Progress Report 8 3/23/18
Summary of Activity:
In the past two weeks we were able to acquire meaningful data about the correlation between intracranial pressure (ICP) and the pressures within the middle cerebral artery. Specifically, we were looking into the effect of ICP increase on the absolute pressure measured directly distal and directly proximal to the clot using our newly acquired pressure gauge from Professor Charnock. This pressure gauge allowed us to see the time-varying pressure changes at these two points in our model for both the occluded and non-occluded state. The baselines for each of these measurements as well as the model setup are included below.
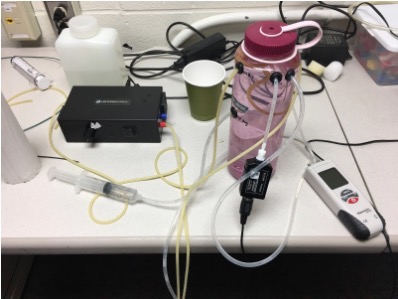
Figure 1: The setup of our model used for obtaining all measurements. The pump is shown in black on the left, the 60 mL syringe leading into a plastic bladder within the pink 1L nalgene is the method of increasing ICP. The ICP is read by the white, red, and black pressure gauge on the right, and the pressures within the simulated middle cerebral artery are continuously outputted to a computer from the small rectangular black pressure gauge shown in the middle.
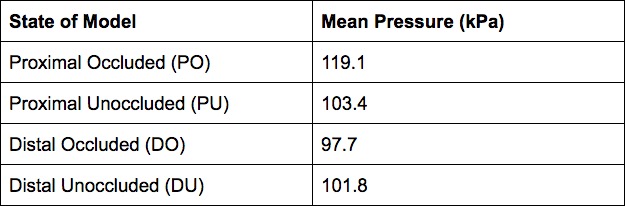
Table 1: Absolute pressure at each of arterial points in occluded vs unoccluded states (constant semi-pulsatile flow, no added ICP).
After doing baseline measurements, we proceeded to measure the absolute pressure at the arterial points with added ICP. We added ICP in increments of 15 mmHg manually using the syringe and visual observation of the ICP relative pressure gauge. In this way, we added 0, 15, 30, 45, and 60 mmHg to the system. The results are shown below for each of the four conditions (PO, PU, DO, DU).
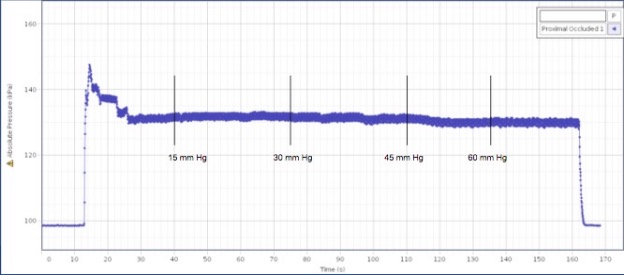
Figure 2: Absolute pressure of PO with noted ICP increase points.
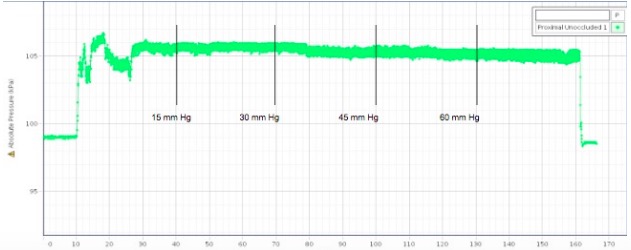
Figure 3: Absolute pressure of the PU with noted ICP increase points.
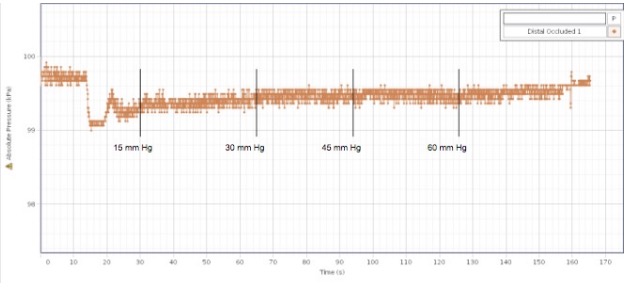
Figure 4: Absolute pressure of the DO with noted ICP increase points.
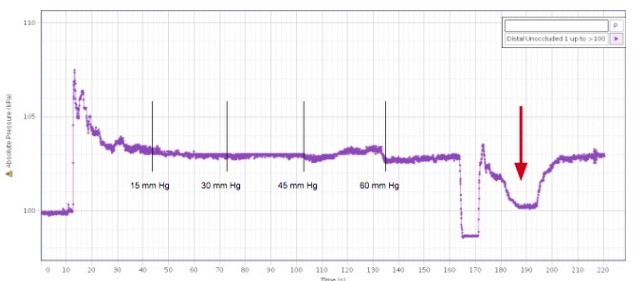
Figure 5: Absolute pressure of the DU with noted ICP increase points. Red arrow indicates drastic ICP increase (discussed below).
Our results showed that there was no visibly significant difference in arterial pressure in any of the conditions as a result of any increase in ICP (Fig. 2,3,4,5). Out of curiosity, we increase the ICP drastically to the maximum we were able (complete syringe depression) in the DU condition (Fig. 5). As a result, we saw a marked decrease in the absolute pressure in DU. We decided to revisit the other conditions to measure a potential change in pressure with a drastic ICP increase. The results are summarized below.
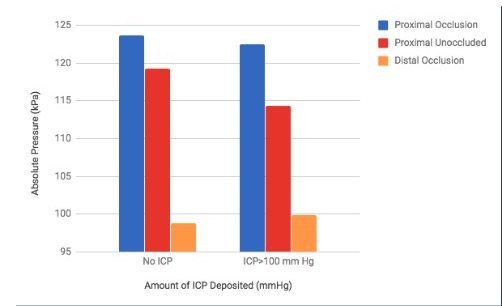
Figure 6: Pressure at the arterial conditions as a result of drastic ICP change.
We found that the drastic ICP increase did not have a significant change in pressure in the PO condition, and a large drop in pressure at the PU condition. The DO condition also showed a slight increase in pressure due to drastic ICP increase (Fig. 6). This was the most interesting change in pressure because an increase in pressure distal to the clot would allow for a more favorable pressure gradient for thrombectomy.
Due to company restrictions, we needed to return the pump to our advisor, Dr. Froehler. As a result, we have been hunting for a new pump to continue our experiments. We have reached out to and identified a few professors at Vanderbilt that are willing to lend us their pumps for use.
Additionally, we secured more pressure gauges from Dr. Charnock that will be more useful for measuring the pressure within the arteries than the pressure gauge we secured last week.
Next week’s plans:
We plan to re-do our experiments with the new pump so that we can get consistent data.
We want to secure a pump that is reliable in setting flow rate and can produce semi-pulsatile flow.
We will start to use a physical clot instead of the clamp to occlude a vessel.
We will also be doing a separation force experiment to measure the force that the thrombectomy catheter can apply to the clot.
Needs:
We need a pump that can produce semi-pulsatile flow with a constant flow rate.
©2026 Vanderbilt University ·
Site Development: University Web Communications