
Update #4
Danielle, Antonio, Hannah
This week, we captured our CT data in a text file and reconstructed it. The shape of our sinogram looks accurate, but there is higher intensity light observed at lower degrees (0 to 30 degrees), which is indicated by the yellow color, and lower intensity light observed at higher degrees, which is indicated by the aqua color. These findings show that one side of the CT scanner is more exposed to light, probably from the classroom window, than the opposite side. Our reconstructed image looks somewhat accurate, but we suspect that our measurements are undersampled. Next week, we will increasing the number of samples/time period and will collect data with the blinds closed and a tarp covering the scanner. Below are images of our sinogram and reconstructed image.
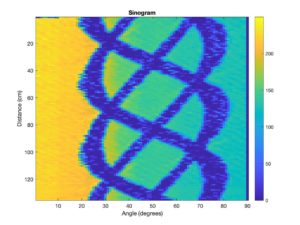
Figure 1: Sinogram
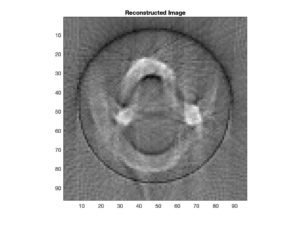
Figure 2: Reconstructed image
Question: What parameters of your scanner and scan method influence resolution? Investigate these.
We have the servo motor moving the swing arm 90 degrees and the stepper motor moving once when the swing arm finishes its rotation. We should switch the order of the servo motor and the stepper motor so that the stepper motor rotates 270 degrees and then the swing arm moves once. This would increase the resolution because the stepper motor is more stable than the servo motor, so it would reduce the probability of motion artifacts.
We also expect the size of our detector and the distance between the fan beam and motors to affect our resolution. We plan to investigate all of these parameters next week and see how the resolution improves.