Morgan Kinney, Tanner Hoppman, Jude Franklin
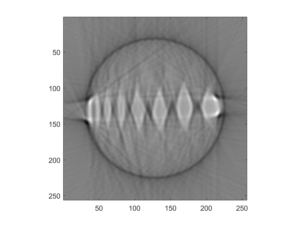
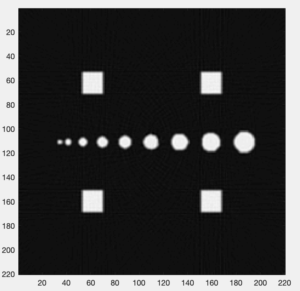
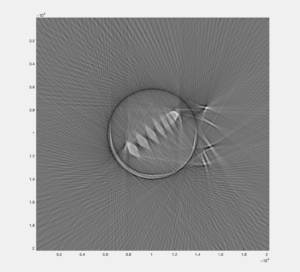
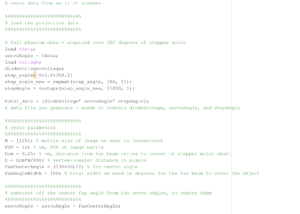
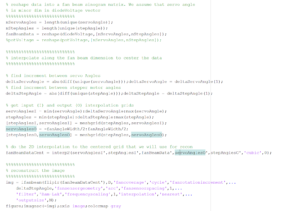
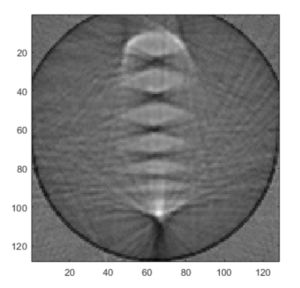
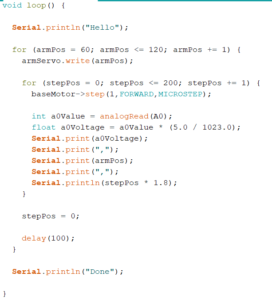
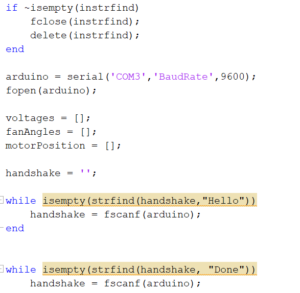
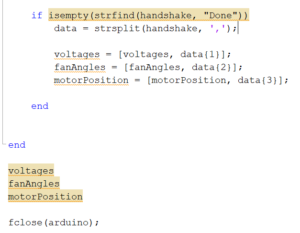
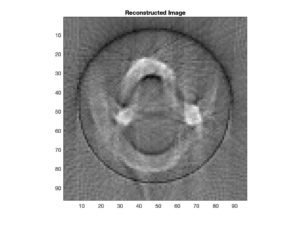
This week we were able to complete the assembly of our scanner and the code to run it so that we could acquire the projection data for our first image reconstruction. The Matlab code used for the reconstruction (Fig. 1) was a modified template designed to work for these IR CT scanners, but in the reconstructed image (Fig. 2) it is impossible to tell which phantom was used. This poor image quality was likely a result of either our method of acquiring the projection data, the reconstruction algorithm, or some other external influence on the system. In any of these cases, we hope to resolve the issue and complete scans and reconstruct images for all the different phantoms with reasonable image quality by the end of the next week.
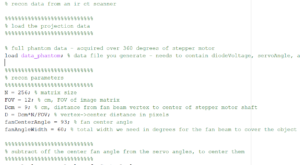
Figure 1. MATLAB code for fan-beam reconstruction of real projection data
% recon data from an ir ct scanner
%%%%%%%%%%%%%%%%%%%%%%%%%%%
% load the projection data
%%%%%%%%%%%%%%%%%%%%%%%%%%%
% full phantom data – acquired over 360 degrees of stepper motor
load servoangle; % data file you generate – needs to contain diodeVoltage, servoAngle, and stepAngle
load step
load voltage
%%%%%%%%%%%%%%%%%%%%%%%%%%%
% recon parameters
%%%%%%%%%%%%%%%%%%%%%%%%%%%
N = 200; % matrix size
FOV = 14; % cm, FOV of image matrix
Dcm = 6.9; % cm, distance from fan beam vertex to center of stepper motor shaft
D = Dcm*N/FOV; % vertex->center distance in pixels
fanCenterAngle = 80; % fan center angle
fanAngleWidth = 90; % total width we need in degrees for the fan beam to cover the object
%%%%%%%%%%%%%%%%%%%%%%%%%%%
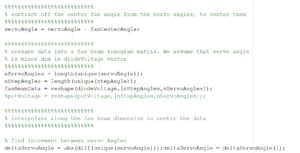
% subtract off the center fan angle from the servo angles, to center them
%%%%%%%%%%%%%%%%%%%%%%%%%%%
servoAngle = servoAngle – fanCenterAngle;
%%%%%%%%%%%%%%%%%%%%%%%%%%%
% reshape data into a fan beam sinogram matrix. We assume that servo angle
% is minor dim in diodeVoltage vector
%%%%%%%%%%%%%%%%%%%%%%%%%%%
nServoAngles = length(unique(servoAngle));
nStepAngles = length(unique(stepAngle));
fanBeamData = reshape(diodeVoltage,[nServoAngles,nStepAngles]);
%%%%%%%%%%%%%%%%%%%%%%%%%%%
% interpolate along the fan beam dimension to center the data
%%%%%%%%%%%%%%%%%%%%%%%%%%%
% find increment between servo Angles
deltaServoAngle = abs(diff(unique(servoAngle)));deltaServoAngle = deltaServoAngle(1);
% find increment between stepper motor angles
deltaStepAngle = abs(diff(unique(stepAngle)));deltaStepAngle = deltaStepAngle(1);
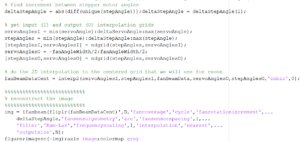
% get input (I) and output (O) interpolation grids
servoAnglesI = min(servoAngle):deltaServoAngle:max(servoAngle);
stepAngles = min(stepAngle):deltaStepAngle:max(stepAngle);
[stepAnglesI,servoAnglesI] = meshgrid(stepAngles,servoAnglesI);
servoAnglesO = -fanAngleWidth/2:fanAngleWidth/2;
[stepAnglesO,servoAnglesO] = meshgrid(stepAngles,servoAnglesO);
% do the 2D interpolation to the centered grid that we will use for recon
fanBeamDataCent = interp2(stepAnglesI,servoAnglesI,fanBeamData,stepAnglesO,servoAnglesO,’cubic’,0);
%%%%%%%%%%%%%%%%%%%%%%%%%%%
% reconstruct the image
%%%%%%%%%%%%%%%%%%%%%%%%%%%
img = ifanbeam(fliplr(fanBeamDataCent),D,’fancoverage’,’cycle’,’fanrotationincrement’,…
deltaStepAngle,’fansensorgeometry’,’arc’,’fansensorspacing’,1,…
‘filter’,’Ram-Lak’,’frequencyscaling’,1,’interpolation’,’nearest’,…
‘outputsize’,N);
figure;imagesc(-img);axis image;colormap gray
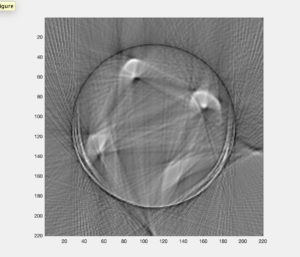
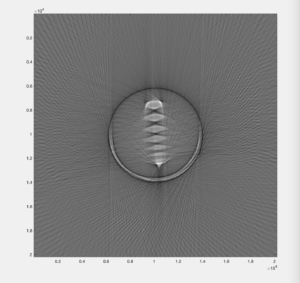
Figure 2. Reconstructed image from real projection data
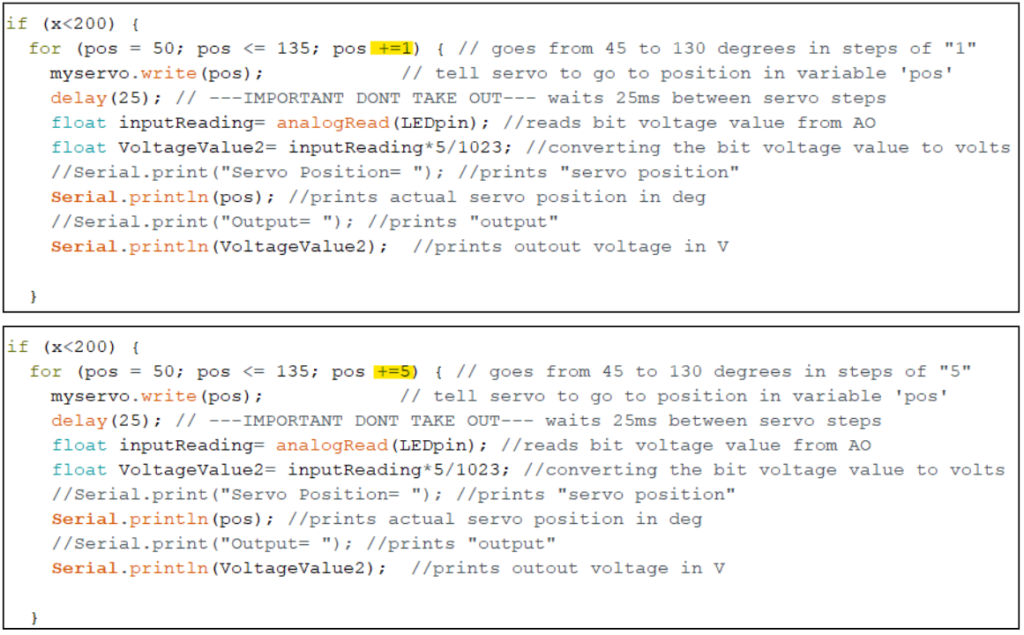
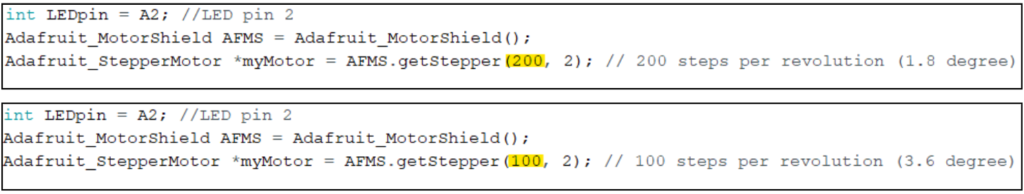
Question: What parameters of your scanner and scan method influence resolution? Investigate these.
Answer: Our resolution for these IR CT scanners is determined by the data acquisition rate set by the arduino, the step angle of the servo arm, and the step angle of the stepper motor. Assuming that the arduino baud rate is sufficient, the stepper motor would be the limiting factor of resolution because it has a minimum step angle of 1.8 degrees while the servo arm can move just 1 degree per step.