MRI correlates of chronic symptoms in mild traumatic brain injury
Kerley, C. I., Schilling, K. G., Blaber, J., Miller, B., Newton, A., Anderson, A. W., Landman, B. A., Rex, T. S. “MRI correlates of chronic symptoms in mild traumatic brain injury.” In SPIE Medical Imaging, International Society for Optics and Photonics, 2020.
Full text: NIHMSID, arXiv
Abstract
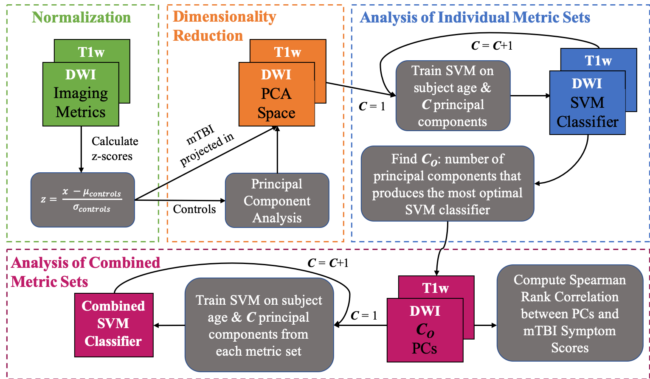
Some veterans with a history of mild traumatic brain injury (mTBI) have reported experiencing auditory and visual dysfunction that persist beyond the acute phase of the incident. The etiology behind these symptoms is difficult to characterize, since mTBI is defined by negative imaging findings on current clinical imaging. There are several competing hypotheses that could explain functional deficits; one example is shear injury, which may manifest in diffusion-weighted magnetic resonance (MR) imaging (DWI). Herein, we explore this alternative hypothesis in a pilot study of multi-parametric MR imaging. Briefly, we consider a cohort of 8 mTBI patients relative to 22 control subjects using structural T1-weighted imaging (T1w) and connectivity with DWI. 1,344 metrics were extracted per subject from whole brain regions and connectivity patterns in sensory networks. For each set of imaging-derived metrics, the control subject metrics were embedded in a low-dimensional manifold with principal component analysis, after which mTBI subject metrics were projected into the same space. These manifolds were employed to train support vector machines (SVM) to classify subjects as controls or mTBI. Two of the SVMs trained achieved near-perfect accuracy averaged across four-fold cross-validation. Additionally, we present correlations between manifold dimensions and 22 self-reported mTBI symptoms and find that five principal components from the manifolds (one component from the T1w manifold and four components from the DWI manifold) are significantly correlated with symptoms (p<0.05, uncorrected). The novelty of this work is that the DWI and T1w imaging metrics seem to contain information critical for distinguishing between mTBI and control subjects. This work presents an analysis of the pilot phase of data collection of the Quantitative Evaluation of Visual and Auditory Dysfunction and Multi-Sensory Integration in Complex TBI Patients study and defines specific hypotheses to be tested in the full sample.
Keywords: mild traumatic brain injury, support vector machine, principal component analysis, MRI