Renal Cortex, Medulla and Pelvicaliceal System Segmentation on Arterial Phase CT Images with Random Patch-based Networks
Yucheng Tang, Riqiang Gao, Ho Hin Lee, Brent V. Savoie, Shunxing Bao, Yuankai Huo, Jeffrey Spraggins and Bennett A, Landman, Renal Cortex, Medulla, Pelvis Segmentation on Arterial Phase CT Images with Random Patch-based Networks, SPIE 2021 Medical Imaging
Full Text
Abstract
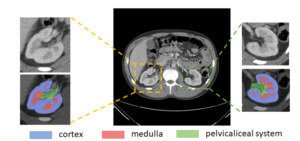
Renal segmentation on contrast-enhanced computed tomography (CT) provides distinct spatial context and morphology. Current studies for renal segmentations are highly dependent on manual efforts, which are time-consuming and tedious. Hence, developing an automatic framework for the segmentation of renal cortex, medulla and pelvicalyceal system is an important quantitative assessment of renal morphometry. Recent innovations in deep methods have driven performance toward levels for which clinical translation is appealing. However, the segmentation of renal structures can be challenging due to the limited field-of-view (FOV) and variability among patients. In this paper, we propose a method to automatically label the renal cortex, the medulla and pelvicalyceal system. First, we retrieved 45 clinically-acquired deidentified arterial phase CT scans (45 patients, 90 kidneys) without diagnosis codes (ICD-9) involving kidney abnormalities. Second, an interpreter performed manual segmentation to pelvis, medulla and cortex slice-by-slice on all retrieved subjects under expert supervision. Finally, we proposed a patch-based deep neural networks to automatically segment renal structures. Compared to the automatic baseline algorithm (3D U-Net) and conventional hierarchical method (3D U-Net Hierarchy), our proposed method achieves improvement of 0.7968 to 0.6749 (3D U-Net), 0.7482 (3D U-Net Hierarchy) in terms of mean Dice scores across three classes (p-value < 0.001, paired t-tests between our method and 3D U-Net Hierarchy). In summary, the proposed algorithm provides a precise and efficient method for labeling renal structures.