Post-Season Puzzle
Posted by John Vrooman on Sunday, April 28, 2019 in National Basketball Association, National Hockey League, Sports Econ Blog.
—Billy Beane, GM Oakland Athletics
In the first round of the current 2019 NHL playoffs five of the eight higher seeded teams with home ice advantage lost their respective series. The higher seeded NHL teams won only 43.5% of the games in the first round overall.
Meanwhile in the NBA first round, all higher seeded teams easily dismissed lower seeded teams as predicted in orderly fashion. The overall winning percentage for the higher seeded teams was 78% and only one of the series went the full seven games.
What can explain the apparent randomness of the NHL compared to the determinism of the NBA reflected in these divergent post-season results?
Competitive Balance in NBA v. NHL Playoffs 2019.
Tournament Seeding
The most intuitive answer for post-season random outcomes is that the NHL seeding process matches up front teams of equal strength in the early (first) rounds.
This could possibly be the case in this post-season comparison, because the NHL tournament is relatively division-centric and the NBA has gradually become more conference-centric over time for precisely this reason. NBA teams with better overall records were being bumped from seeding in the post-season by inferior teams that placed higher in a weaker division of the same conference.
NHL Division Seeding Format
Since 1980,16 teams qualify for the Stanley Cup Playoffs. The format is division-based with two wild cards from each conference. The top three teams in each of the 4 divisions will make up the first 12 teams in the playoffs. The remaining four spots go to the next two highest-placed finishers from each conference, regardless of division.
In the First Round, the division winner with the best record in each conference will be matched against the wild card with the worst record; the wild card with the better record will play the other division winner. The teams finishing second and third in each division will meet each other in the First Round in the bracket headed by their respective division winner.
Home-ice advantage in the first two rounds goes to the team that placed higher in the regular-season standings. In the Conference Final and Stanley Cup Final, home-ice goes to the team that had the better regular-season record, regardless of its final standing in its respective division.
NBA Conference Seeding Format
Since 2016, the NBA has seeded playoff teams solely by their record, throwing out the top-four protection for teams who win their divisions.
Prior to 2016, division winners were guaranteed no lower than the 4 seed, a rule that became heavily criticized in 2015 when Portland ended up 4 in the stronger Western Conference despite the sixth-best record in the conference.
Teams in each conference are now seeded from one to eight by their won-loss record, regardless of how they finish in their division.
NBA 2019 season standings. Tanking the NBA Draft
Over/Under Seeding with the NHL Format?
NHL Division Seeding with NBA Conference Format
[table id=4 /]
In the table above, the actual NHL 2019 post-season match-ups are shown by a team’s and opponent’s rank within their division and conference, and then compared to a hypothetical seeding using the NBA conference reverse rank format. The winning Round 1 teams are shown in the eight highlighted rows with their ranks and series win probabilities against opponents in both seeding scenarios.
Based on the NHL division formula 12 teams faced lower (rank dif > 0) or equally (rank dif = 0) seeded teams than they would have using the NBA format. The notable 4 exceptions (rank dif < 0) occurred for seeds 2 and 3 in the weaker 2 divisions (Atlantic and Pacific) where only the required 3 teams qualified. These 2 polarized divisions had the highest overall conference seed with no wild card teams.
If the division format is the cause of the apparent randomness of the NHL playoffs, then two upsets should have occurred in this pair of 2-3 series that matched these 4 teams that were facing tougher opposition than under the NBA format.Two of the under-seeded 2-3 teams had to lose because they are playing each other by rule.
As favored 2-seeds, the Boston Bruins and San Jose Sharks each defeated their 3-seed opponents, Toronto and Vegas. In the process the last of the NHL big-market clubs and last year’s Cinderella expansion team were eliminated.
All of the top seeded teams in the 4 NHL divisions lost to the lowest seeded wild-card teams from their conferences. Upsets appear in the table as an underdog bottom 4 team defeating a favored top 4 seeded conference opponent.
Two of the NHL upsets in random round one came from wild-card teams (Colorado and Columbus) that defeated division leaders that were seeded in the same (1-8) they would have been seeded with the NBA reverse-rank conference formula. The same is true of St. Louis facing Winnipeg in either a 2-3 match division match or a 3-4 conference series.
The other two upsets by the Dallas Stars and Carolina Hurricanes were related to the NHL under-seeding format. Winning teams that faced easier opponents (lower seeds and higher series win probabilities) or losing teams that faced tougher teams (higher seeds and lower chance to win) are shown in bold type in the above table.
The division based seeding format may be self-defeating in terms of premature elimination of quality teams ranked 2 or 3, or the slight advantage to the 7th best team (where winning chances improve by 4% – 6%) in either conference, but it does not appear to be the primary cause of the random outcomes in the first round of the NHL playoffs, because 3 upset teams had the same opponents under either format.
Do the better NHL and NBA teams usually win?
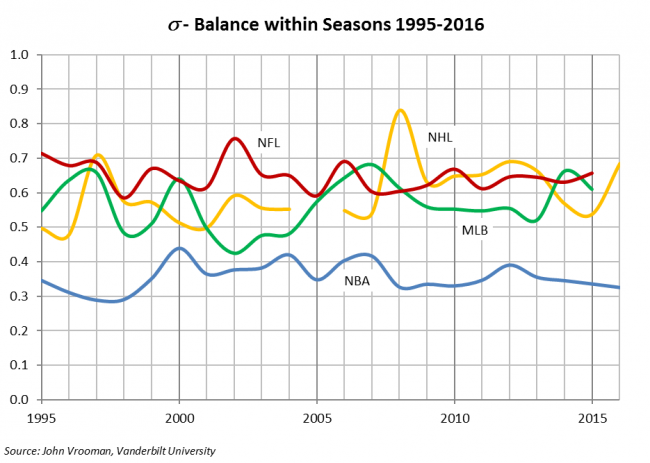
in the graph below observed standard deviations of winning percentages within the 2016 season show the spread between good and bad teams in the Big 4 NA sports leagues. For most recent seasons click here.
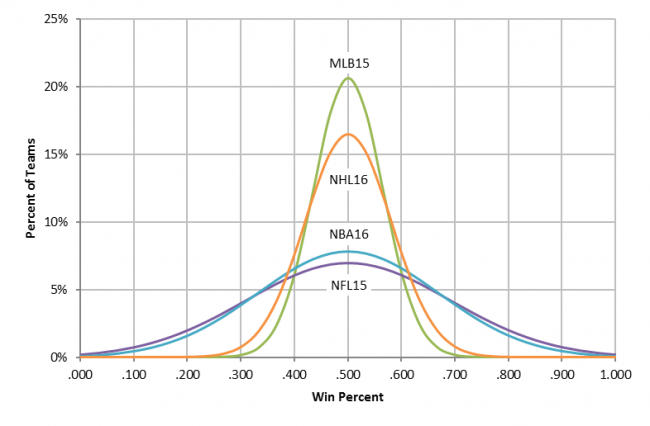
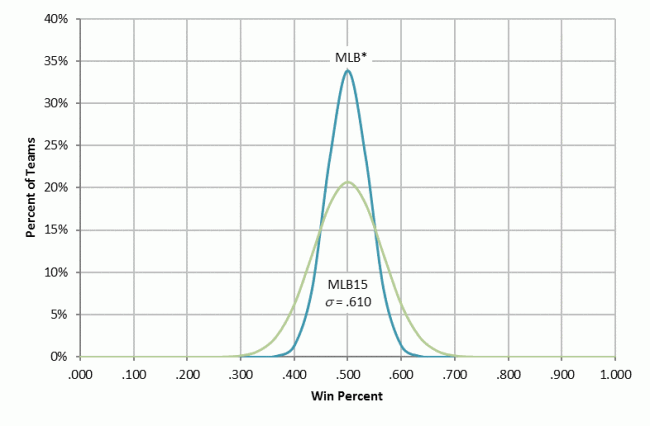
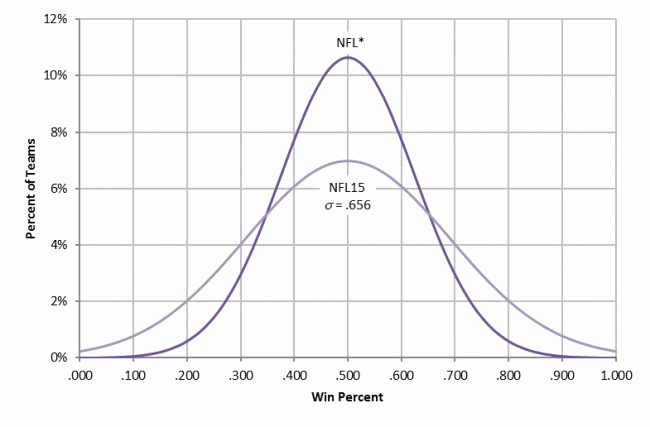
MLB15 and NFL15 are the actual observed standard deviations in the 162 game MLB and 16 game NFL seasons. NBA16 and NHL16 are the observed standard deviations in regular season win percentages for both 82-game leagues in 2016.
Based on these observed standard deviation results it appears that the spread between good and bad teams is the greatest in the NFL and NBA and the least in MLB with the NHL lying somewhere in between. This is not necessarily true because accurate inter-season comparisons of competitive balance across sports leagues need to be normalized for different season lengths.
Ideal (expected) standard deviations for n-game season
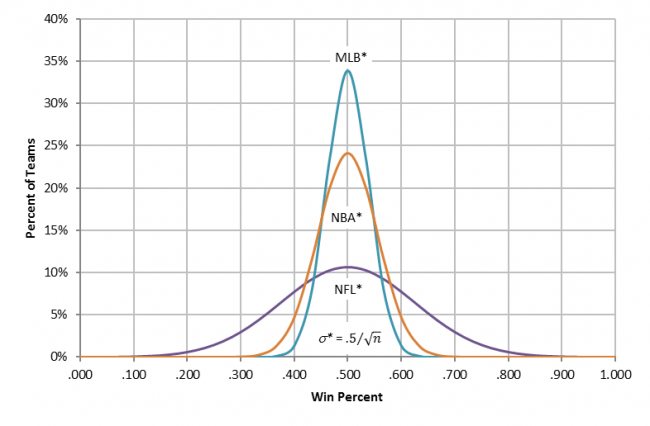
The competitive balance of sports leagues depends on elements of chance (good and bad luck) as well as asymmetric team talent. Elements of chance (good and bad luck) dissipate as season length increases and the measures of talent asymmetry approach the truth.
The standard deviation of wins within a league’s regular season varies inversely with the square root of season length (σ* = .5/√n), because each game is only one sample of the relative talent between clubs. (Like one coin toss.)
In the hypothetical (idealized) graphs above, NBA* = NHL* =.055 would be the ideal standard deviation of win percentages in perfectly balanced leagues with 82 game regular seasons. NFL* = .125 would be the ideal standard deviation for a 16-game season and MLB* = .039 would be the ideal parity for a perfectly balanced season (sample size) of 162 games.
In the above graph the observed imbalance (win spread) in the NBA appears to be more like the NFL than the NHL. After controlling for season length it now appears that the NBA regular season is more imbalanced than the NHL (same σ* with higher σ) or the NFL (same σ with lower σ*).
NBA CBI 2016: Ideal/actual standard deviation (0 ≤ σ ≤ 1)
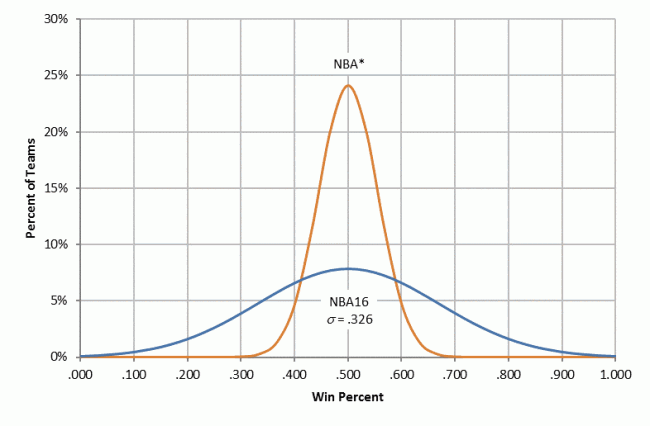
A relative competitive balance index for the NBA (σ = NBA*/NBA16 = .055 /.169 = .326) ranges between perfect (random) balance when NBA16 approaches NBA* (NBA*/NBA16) = 1 and an unbalance σ = 0 as NBA16 increases in magnitude.
This competitive balance index CBI can be used to compare balance in leagues of different season lengths n. This CBI is preferred to its well-known inverse Noll-Scully index because the values range between 0 and 1.
NHL CBI 2015 and 2016
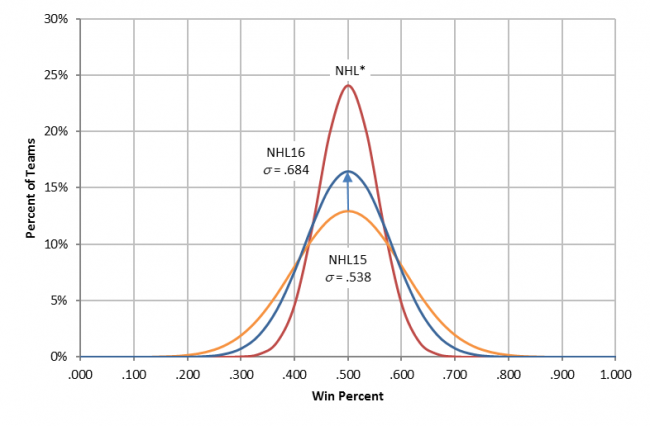
This controlled result supports the general conclusion that the NHL is more competitive balanced (random) than the NBA and that the NHL is approaching the random competition of the NFL.
The NHL and the NFL both have hard salary caps and compared to the NBA, which has a soft cap that can be exceeded with several exceptions. The NBA soft cap is now backed by a effective luxury tax on payrolls with increasingly progressive rates. MLB has no salary cap and a luxury tax that until recently only affected a few teams with exceptionally high payrolls.
Here are the normalized CBIs for MLB and the NFL for 2015. For most recent seasons click here.
MLB CBI 2015
NFL CBI 2016
Click here for updated XL files on competitive balance.
The result of the MLB 162-game regular season is the Truth.
Solution: In MLB the season result is the statistical Truth, but in the NBA the result of each game is the Truth.
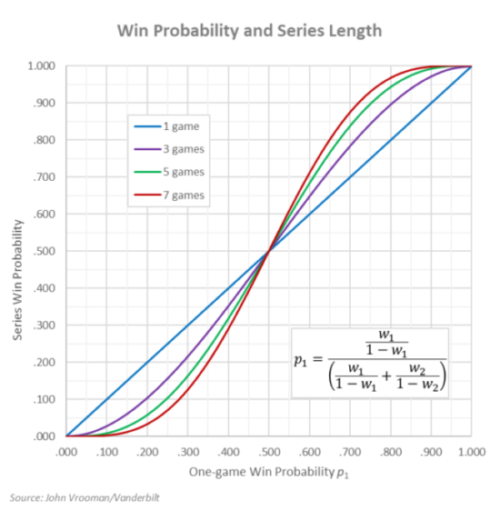
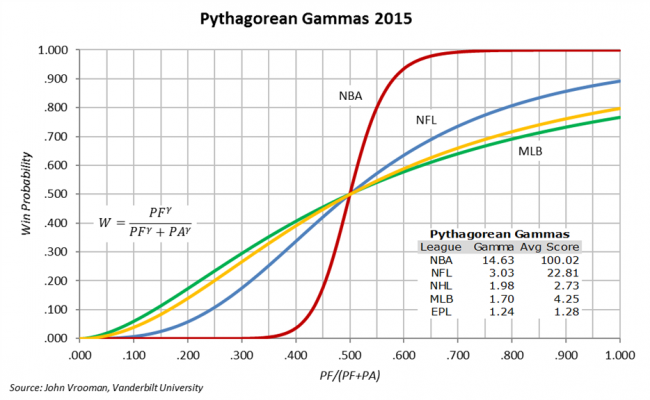
The same reasoning that the best team in MLB usually prevails at the end of a relatively long 162-game season, can be used to support the argument that the better team will usually win the average NBA 90-shot 100-point game (45% efficiency). Each NBA possession is a sub-game within the game.
For example, the Portland Trailblazers may lead the Golden State Warriors deep into the second half but the better team will emerge by the game’s end and the probability of the higher seed’s winning only increases with the series length. Top seeded GSW recently swept the 3-seed Blazers 4-0 in the 2019 NBA Western Conference Finals after trailing late in the last 2 games of the series.
By comparison the average NHL team (yellow CPD in above graph) takes about 30 shots on goal (fewer during the playoffs) and scores and average of less than 3 goals per game (10% efficiency) depending on the goal-tender.
Still in progress…
©2024 Vanderbilt University · John Vrooman
Site Development: University Web Communications