Web Updates
Web Update # 9 – 4/11/18
In the past two weeks, we have put the finishing touches on our GUI, optimized our algorithm (as best we could with the given data), and successfully infused glucose (caught in a well plate) via serial communication with our PC-pump interface. The GUI itself did not change at all from our previous update, however, we have now added a pop-up “Warning” window that allows the physician to confirm or override infusion. This window pops up each time the physician presses the green “INFUSE” button on our GUI. The window is shown below:
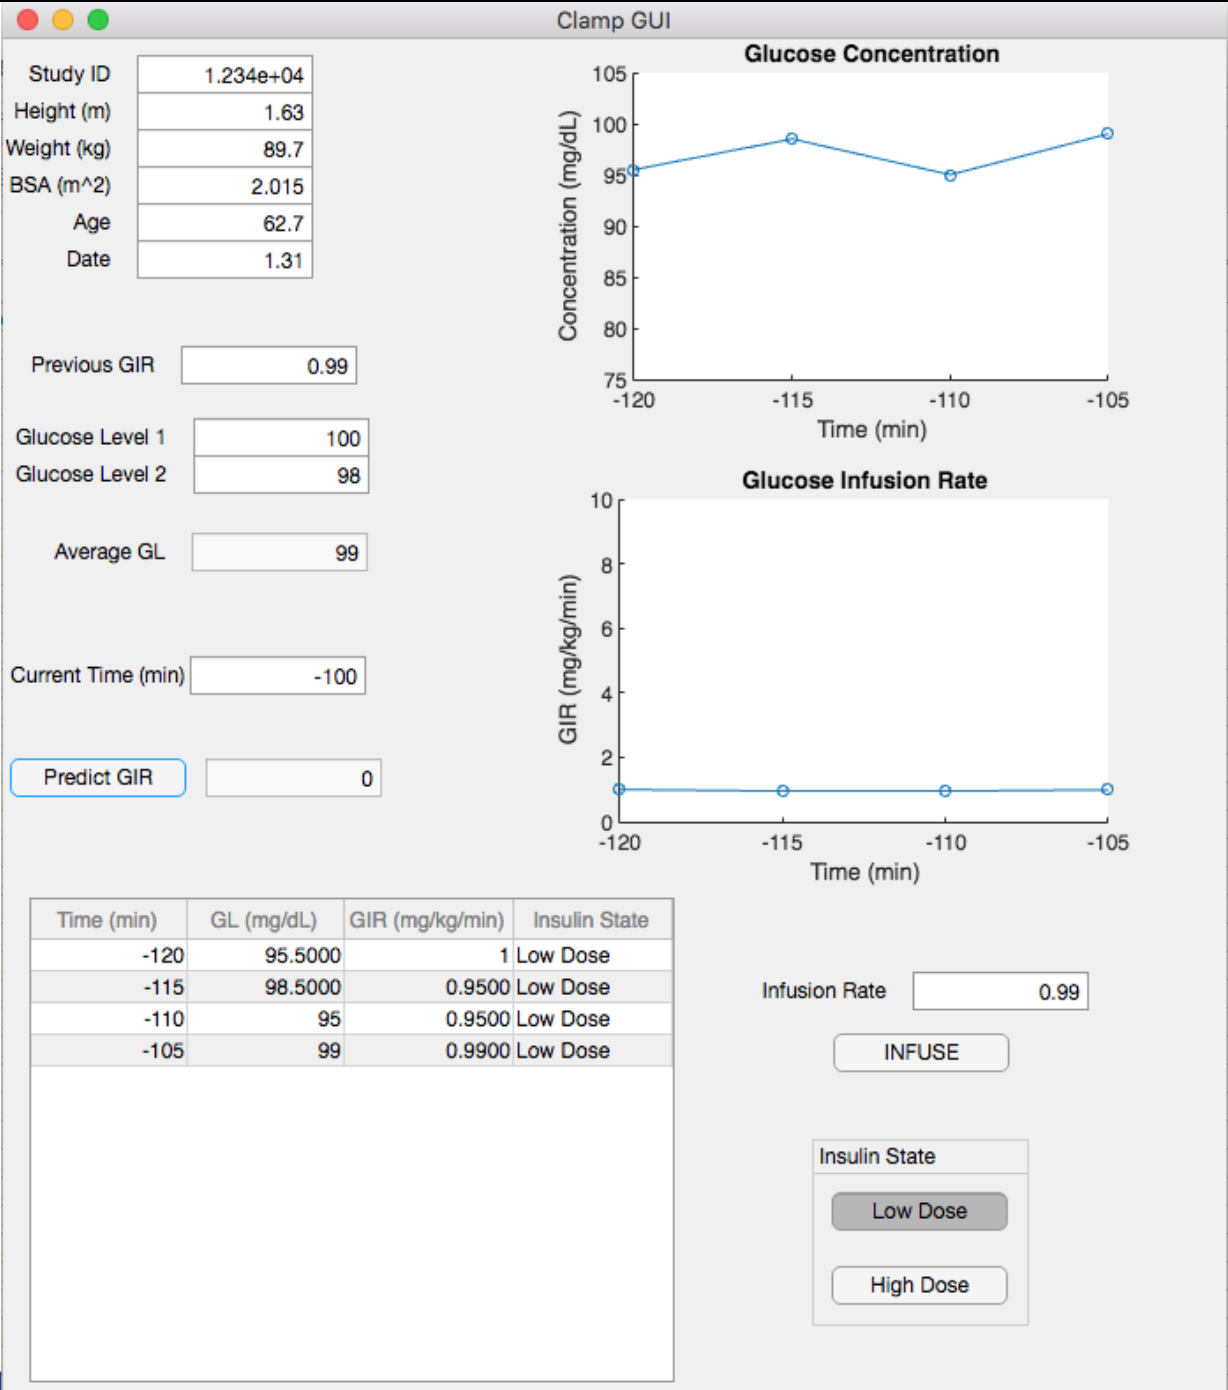
Our algorithm itself is now optimized as well. The primary form of optimization came from linear regression kernels in Python that trained our algorithm via machine learning. Adding all of the subjects and all of the demographic data that Dr. Luther had access to allowed a much more powerful machine learning process than we previously had achieved. We utilized this updated algorithm in a side-by-side study with one of Dr. Luther’s recent studies. Our predictions led to fluctuations of plasma glucose that remained between 94-101 mg/dL, with one outlier. This is a great start for our algorithm and these levels are within Dr. Luther’s desired limits for data validity and patient safety. A visual representation of this data is seen below: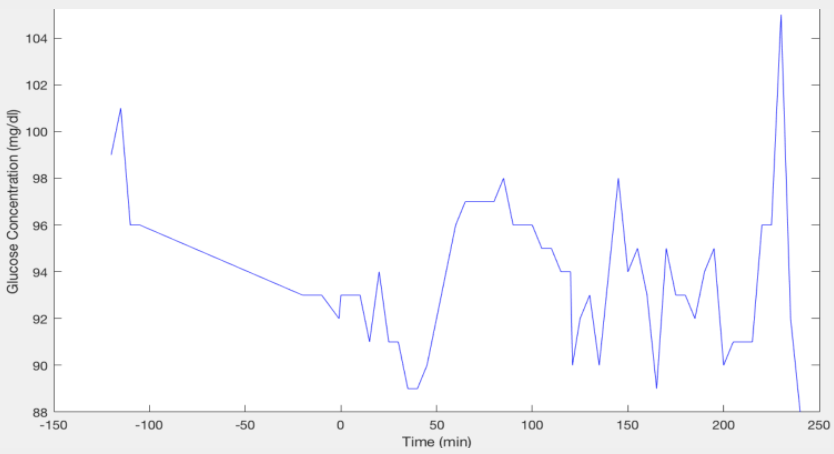
Finally, we have successfully infused glucose via our PC-pump interface. The PC communicates with the Kent Scientific Genie Syringe Pump via serial communication. All infusion rates are predicted and controlled within the MATLAB GUI. A visual of this device set-up is below. Of course, this is more of a proof of concept due to safety and regulatory issues. 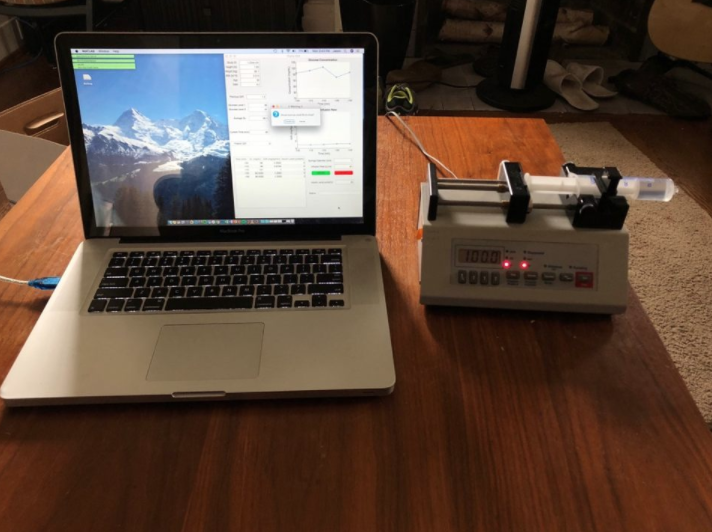
We have finalized our project for senior design at this point and have finalized our poster as well (please see the “Poster” tab of our website). At this point we would also like to discuss our conclusions and future directions. Currently, our algorithm can predict glucose infusion rate given demographic parameters and previous GIRs for a certain subject as it is run alongside a clinical study. This is useful to Dr. Luther, however, he still finds himself relying on his clinical judgment in some cases. With an improved algorithm, we could accurately predict GIR without any necessary physician intervention. Therefore, our future directions include improving the machine learning algorithm using such tools as Python inverse reinforcement. Additionally, we wish to optimize our algorithm with more data from an increase in clinical studies. And finally, we wish to test our algorithm-pump interface in animal studies.
—————————————————————————————————————-
Web Update #8 – 3/28/18
Much of the past two weeks has been focused on two things: Improving the machine learning algorithm in Python, and attempting to prove the functionality of our algorithm with the syringe pump.
In Python, we now have a first iteration of our machine learning algorithm using the “Support Vector Regression Kernels” and a normalization of the relationship between demographics and GIR as linear. Code for this is below:
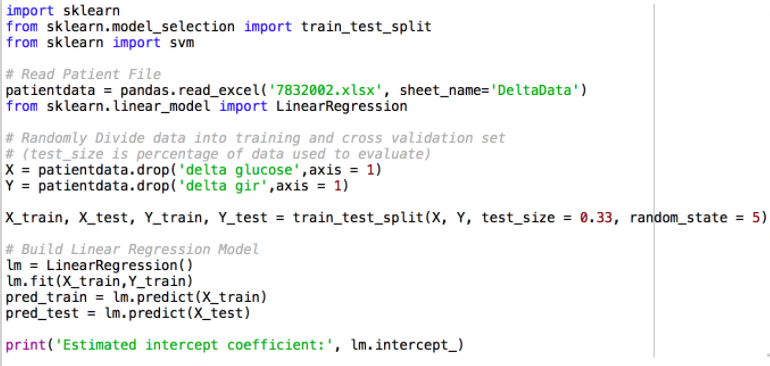
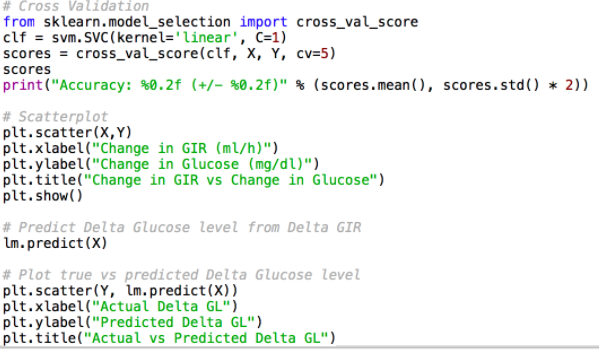
Unfortunately, this was not very accurate for a one patient study. However, we aim to add all of the subjects this week so that the algorithm has more data to learn from. Next steps include enabling the Python script to accept new data during the study to improve the algorithm, implementing code to communicate the predicted GIR from Python to MATLAB, and including all of the demographic parameters in Python to improve the accuracy of the algorithm.
Additionally, we were given the opportunity to sit in on one of Dr. Luther’s studies this past Friday and run our algorithm side-by-side. The subject was a patient who we already had demographic data for, so we ran the algorithm ahead of time first to see what our predictions would look like based on this subject’s previous GIR and glucose levels. Our algorithm was fairly accurate and predicted the GIR within a ten percent error of what Dr. Luther actually did. We are very happy with this success and feel that we will be able to optimize the algorithm in the coming weeks.
Finally, we have been working closely with Dr. Walker this past week to finalize our grant proposal. We have uploaded an updated version of our proposal in the “Grant Proposal” section of our website.
—————————————————————————————————————-
Web Update #7 – 3/14/18
We have spent the last two weeks focusing the majority of our time on both the machine learning algorithm in Python, and the syringe pump proof of concept.
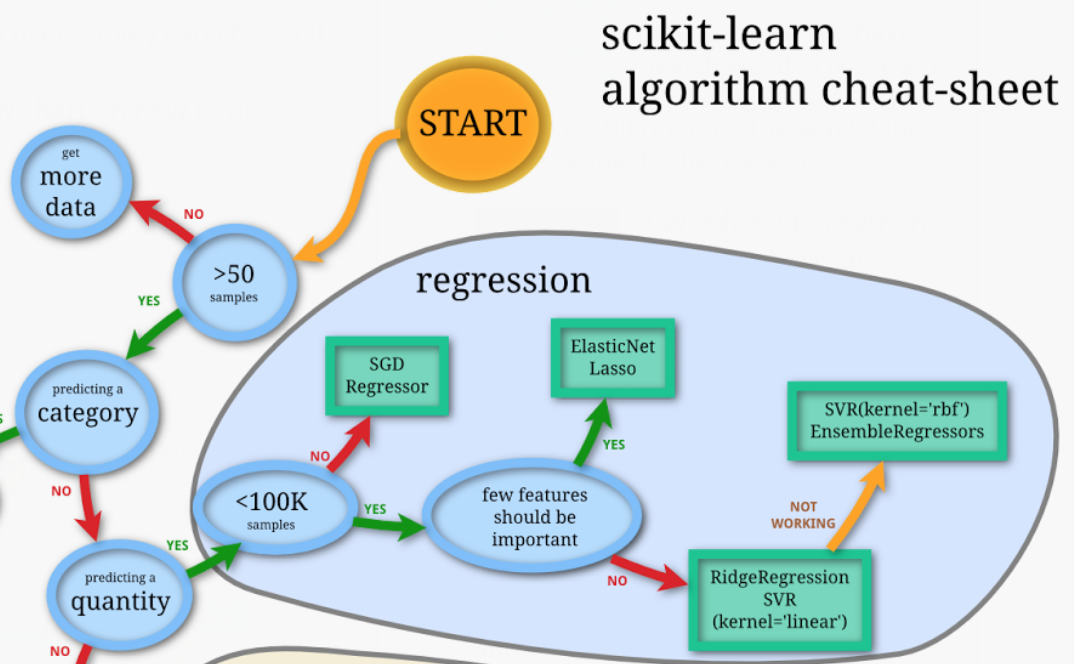
In Python, we are using “Support Vector Regression Kernels.” We will be normalizing the relationship between demographics and glucose infusion rate as a linear relationship, for simplicity’s sake. If we think of dX as change in plasma glucose levels, and dY as change in glucose infusion rate, then we can correlate these values in Python to predict a new Y (glucose infusion rate) for each time point. The initial glucose infusion rate (Y_initial) is a function of demographics and comes from our original multiple regression model that we ran on Dr. Luther’s patient data. From this, each change in glucose infusion rate (dY) is a function ONLY of each change in plasma glucose level (dX). If this does not work, we will have to consider using a radial basis function in Python for our kernels.This is a real-valued function whose value depends only on the distance from the origin. We have been relying on the following cheat-sheet provided to us by a CS professor at Vanderbilt to progress through several iterations of machine learning in Python:
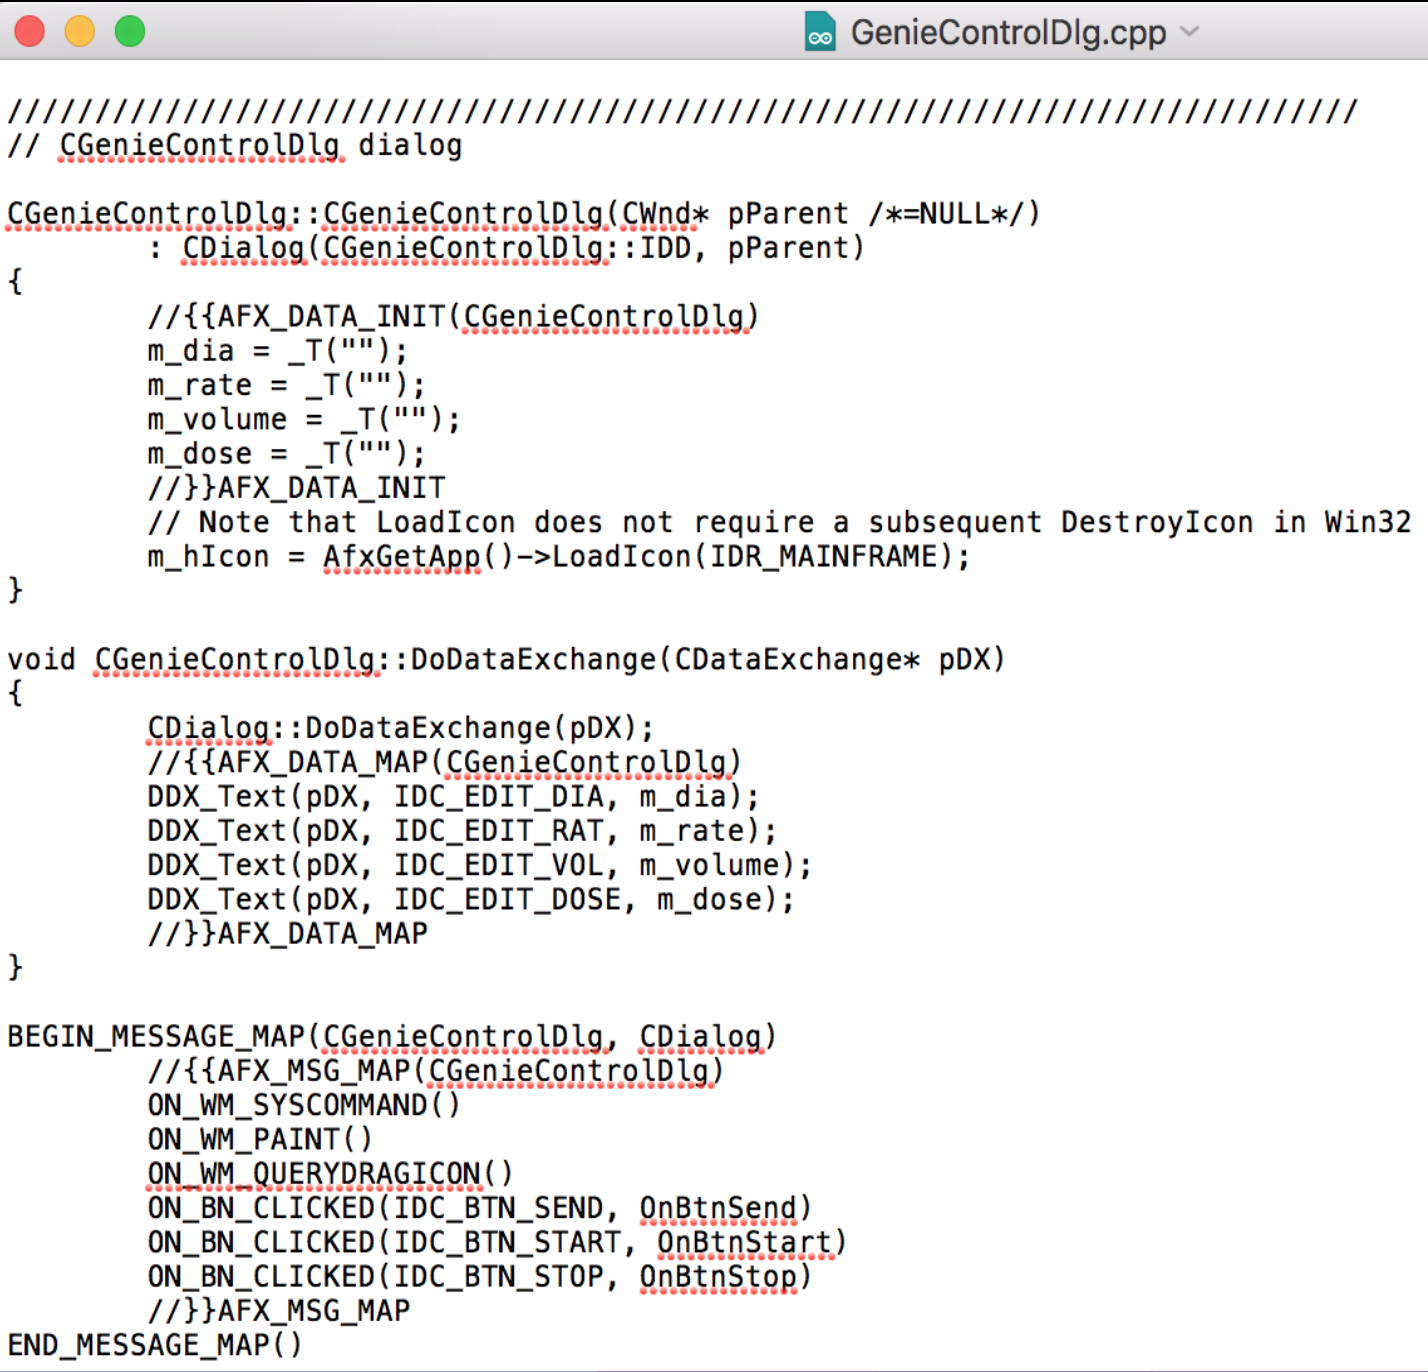
In regards to our syringe pump proof of concept, we are making great progress. We have been working closely with Dr. Andre Diedrich in VUMC and have developed a code in C++ that can write to the pump and change values such as diameter of syringe, flow rate, and volume. This works via serial communication and a text-based dialogue, such as DIA == set diameter in mm. A screen-grab of the portion of the code that does the communicating is below:
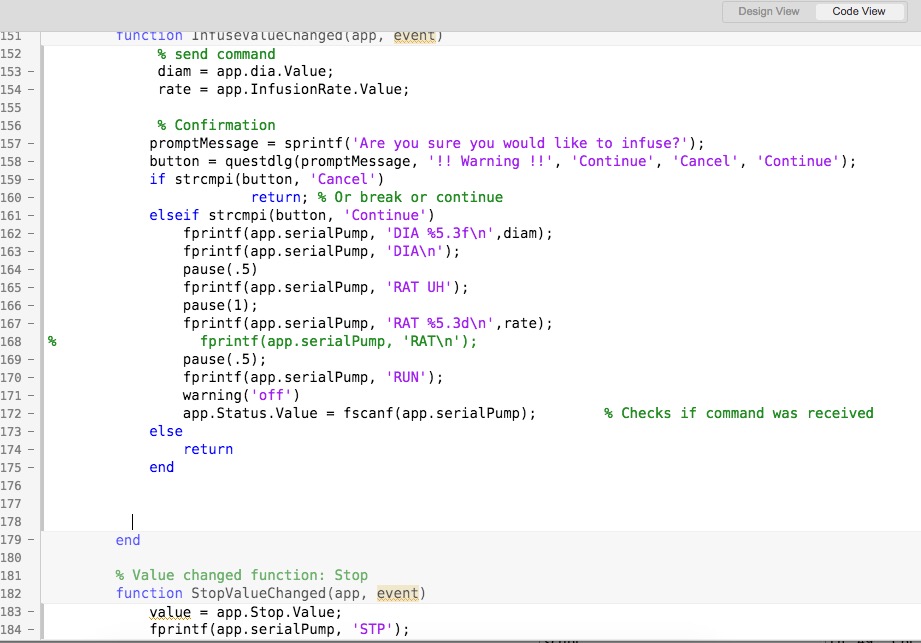
We are now working to implement this code to MATLAB. We have utilized the ‘fprintf’ serial communication syntax to write the same commands that we did in C++. We linked this to the “INFUSE” button on our GUI. The existing MATLAB code that we have for this is below:
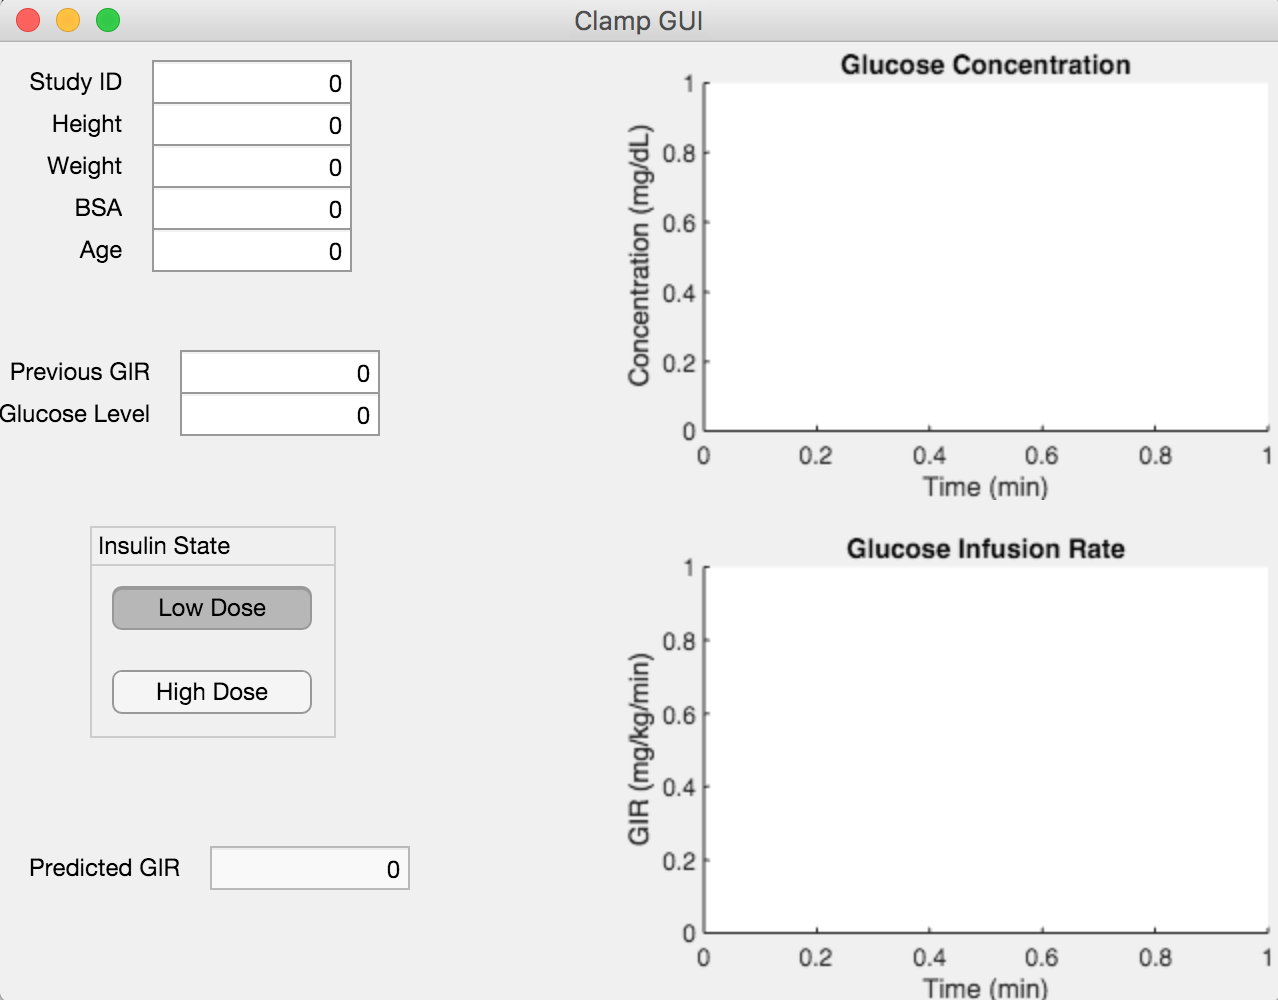
We also updated our GUI slightly to better link it to the MATLAB code:
—————————————————————————————————————-
Web Update #6 – 2/21/18
We have spent the last week working on transferring out algorithm from MATLAB to Python, where we will be training in via machine learning. We will be using the Support Vector Regression to build the algorithm using scikit in Python. This is open source and one of the best coding languages for machine learning. Because we all have none to limited experience with Python, this is a time-consuming process due to the steep learning curve.
Furthermore, we have acquired a syringe pump from Kent Scientific and have also ordered syringes and a 20% dextrose glucose solution. For the time being, we are using Dr. Diedrich’s existing small pump program which is in C++. We are looking into ways to use MATLAB or Python instead of C++. Our next steps will be to continue converting our algorithm into MATLAB and to also work on interfacing with the pump using Dr. Diedrich’s program
—————————————————————————————————————-
Web Update #5 – 2/7/18
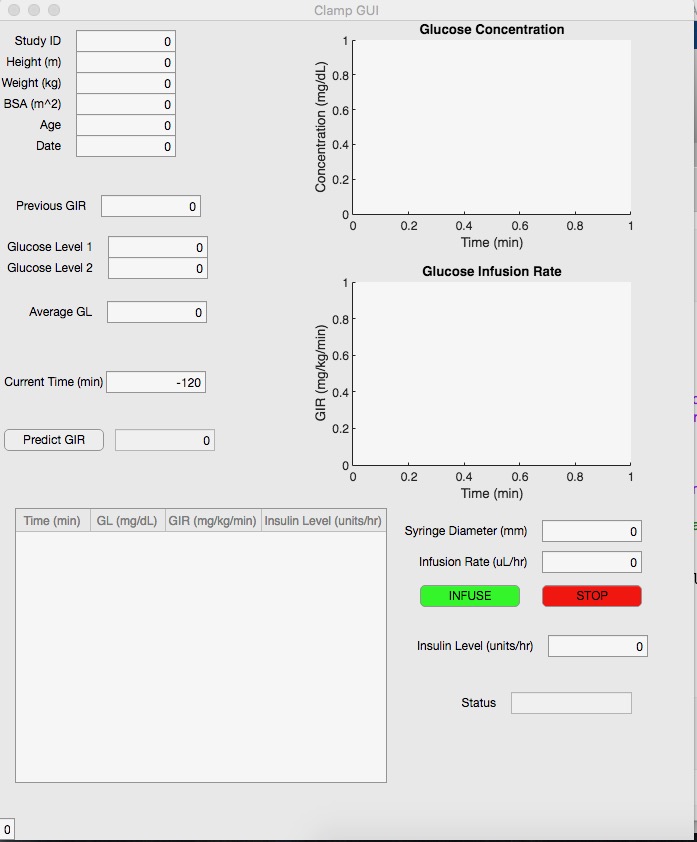
We have now nearly optimized our GUI, adding on several components that Dr. Luther has requested. Using our multiple regression analysis, we first initialize the glucose infusion rate. From this initialization, we currently utilize the existing algorithm from the DeFronzo et al. 1979 paper detailing hyperinsulinemic clamp studies. Dr. Luther does not use this algorithm because he has been unsuccessful with it, but it will at least provide us with a framework for the first iteration. That algorithm is as follows: GIR = ((Gd-Gi)(10)((0.19)(body weight))/((Ginf)(15)) + (((SMi-2)(Gd)(FMi-1))/Gi), where Gd is the desired plasma glucose concentration, Gi is the actual plasma glucose concentration, Ginf is the glucose concentration in the infusate, SMi is the metabolic component (arbitrary), and FMi is the ratio of actual to desired plasma glucose. The next step in our algorithm will be to utilize machine learning to improve it based on a wealth of hyperinsulinemic clamp study data from VUMC. The most up to date GUI can be seen below:
We have also begun working on interfacing our algorithm with the glucose pump itself. Dr. Luther uses an Alaris infusion pump, which will be difficult to interface with and also difficult to get approved by the FDA. So, we are thinking of beginning with a proof-of-concept pump interface utilizing a syringe pump. Using MATLAB, we would use serial communication to provide the pump with the current GIR, which could be overridden by the physician if needed. We are working with Dr. Andre Diedrich on this portion of the project.
Our next steps will be to meet with several computer design professors and begin working on the machine learning aspect of our algorithm. Simultaneously, we will begin to work on the code to interface with the syringe pump via serial communication.
—————————————————————————————————————-
Web Update #4 – 1/17/18
Our linear regression analysis allowed us to see which parameters were predictive for an initial glucose infusion rate when switching to high dosage during a hyperinsulinemic clamp study. While this will provide us with a prediction for an initial glucose infusion rate, it is not able to predict any rate changes thereafter. We are working to come up with an algorithm that would tell the physician if any changes needed to be made to the infusion rate based on a blood glucose reading from just prior. We are meeting with a biostatistician and working with Dr. Luther on the first iteration of this algorithm.
In the meantime, we have begun designing a graphic user interface (GUI) in MATLAB for our algorithm. This GUI will consist of inputting demographic data, previous GIR, and current glucose levels. The output will be the predicted GIR. Additionally, we will have real-time graphs showing both glucose concentration over time as well as glucose infusion rate over time.
Next steps will involve implementing the algorithm into the GUI for completion of its first iteration, followed by the first round of clinical trials.
—————————————————————————————————————-
Web Update #3 – 11/29/17
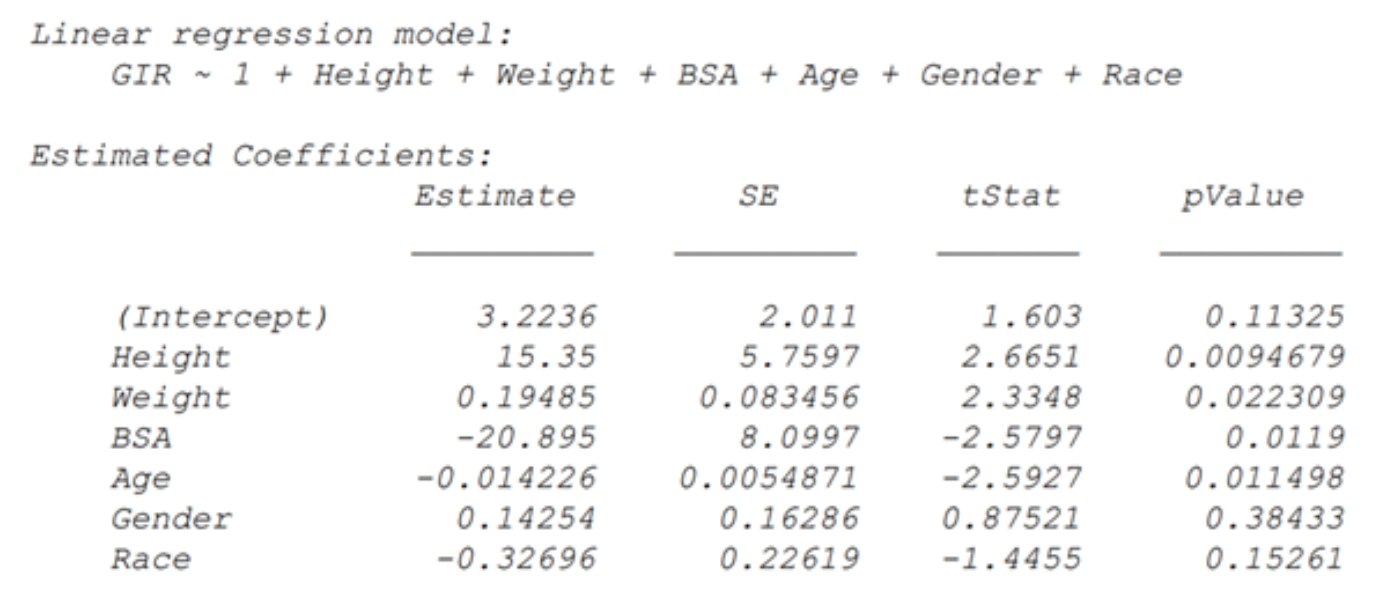
At this point we have completed the preliminary data analysis of the existing hyperinsulinemic clamp study data from Dr. Luther. Sorting an visualization of the data in MATLAB allowed us to move on to the more important step, the multiple regression analysis. This analysis examined six demographic predictors: height, weight, body surface area, age, gender, and race. In determining the weighted score for each of these demographics and their respective effect on glucose infusion rate, we found that height, age, body surface area, and weight were the best predictors of glucose infusion rate, in that order (p = 0.0094679, p = 0.011498, p = 0.0119, and p = 0.022309, respectively). Gender and race were statistically insignificant (p = 0.38433, p = 0.15261, respectively) and so will not be used in our model. Results of the multiple regression are below:
These results will provide the framework for the first iteration of our algorithm, which we are beginning now. We also will be performing another multiple regression on demographic predictors of insulin sensitivity. Finally, we wish to acquire a continuous glucose monitor for more time samples and more accurate infusion rate adjustment.
————————————————————————————————————-
Web Update #2 – 11/09/17
We have begun diving deeper into the database that Dr. Luther provided. We are currently sorting and visualizing the data, and are utilizing the following struct in the process: data > ID; ID; ID > Period 1; Period 2 > Time (-115); Time (-120) > GIR; Glucose level. Visualization will occur in three primary forms: GIR vs. insulin; GIR vs. glucose; and time vs. insulin. After sorting and visualization, we will be performing multiple linear regressions to determine the weights of the demographic factors (age, gender, race, and BMI). This will allow us to begin forming the first framework of the algorithm. We are also meeting with Dr. Luther and his biostatistician next week to work on learning how to use R to do data analysis.
————————————————————————————————————-
Web Update #1 – 11/02/17
We have already begun our weekly meetings with our advisor, Dr. Matt Luther at VUMC. Our first meeting allowed us to learn about the studies he performs on patients with kidney or endocrine problems. Dr. Luther utilizes a hyperinsulinemic clamp to control glucose infusion rates (GIR) and determine a patient’s insulin response. He currently adjusts the GIR on the fly based on his clinical judgment. However, he is interested in an algorithmic approach that could be applicable to a variety of endocrine studies.
Dr. Luther provided us with a vast database of results from previous studies, as well as demographic information for each patient. Along with this database, we aim to draw upon an existing Excel algorithm and implement it to a MATLAB code that allows us to standardize the algorithm and make it more controlled. We will implement machine learning mechanisms so as to improve the algorithm with each subsequent study. Our next steps will be to further analyze this database to determine which demographic values provide the best predictors for insulin response. Dr. Luther suggests that BMI, age, and gender are the best starting points. We aim to compile this matched data and present it to Dr. Luther at our next meeting.
©2026 Vanderbilt University ·
Site Development: University Web Communications