Student Direct Assessment Measures
Overall Data Collection Procedures
Student direct assessment data for the Math Follow-Up Study were collected electronically, using either E-Prime or FileMaker software. For each of the computer-based assessments, E-Prime software was used to collect information about students’ accuracy and response times. Assessors obtained student information for all other tasks using FileMaker software. The FileMaker system had built in checks which notified data collectors instantly if any questions were skipped, if the criterion for the ceiling and/or basal was not met, etc.
Assessors saved copies of their data and shared it remotely using Accellion, Vanderbilt’s secure file-sharing platform. Individual assessor files were checked and then imported into a master database.
By using a paperless system, we were able to eliminate the need for double-entry of the data, which allowed for quicker access to the final dataset at the conclusion of the data collection period.
Student Direct Assessments
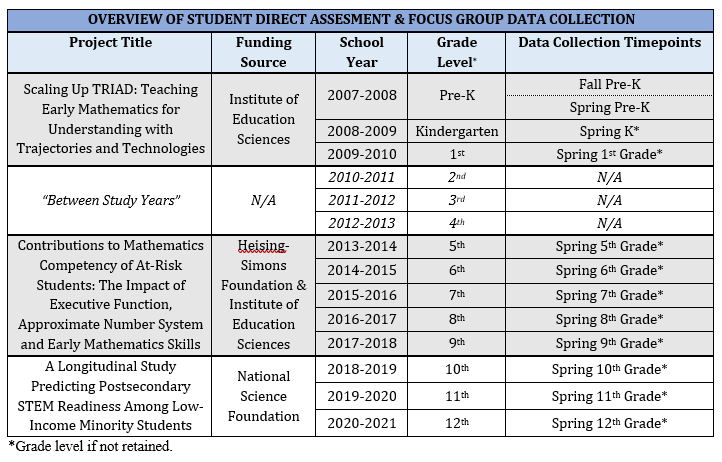
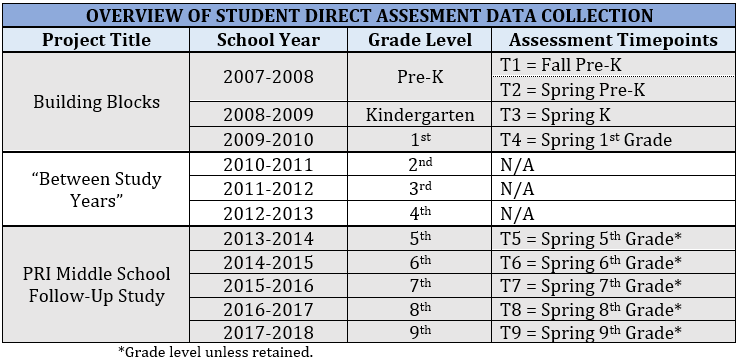
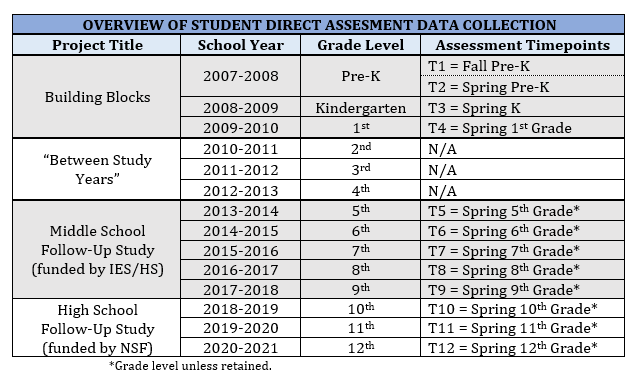
All student participants in the Math Follow-Up Study also participated in a previous longitudinal study of early math skills. The following chart provides an overview of the student direct assessment data collection timepoints for the original study (“Scaling Up TRIAD”), as well as the two follow-up grants.
As the chart illustrates, data collection for the follow-up studies began in Spring 2014 when most students were in 5th grade. Since that time, project staff have directly assessed the math knowledge and math-related skills of more than 500 students annually. From T5 through T8, direct assessments with student participants were administered each spring in two sessions lasting approximately 45 minutes each. Beginning with T9 data collection, participants completed one 45 minute assessment session. Assessments were individually administered inside a quiet room within the child’s school.
All data collectors completed a rigorous training, practice, and certification process before being sent out into the field to work with study participants. Assessors completed three days of formal training and then were given opportunities to practice the assessments with each other and with project staff. Following practice, data collectors administered their session to a member of the project team. If the pre-appraisal attempts were completed successfully, assessors next completed a video of themselves giving their session to a consented non-study child. Videos were scored using a scoring rubric, and assessors had to obtain a minimum score of 85% in order to become certified.
Click here to view an example of the video certification form.
The student direct assessment measures administered for this project fit into several broad categories: standardized assessments, nonstandard math assessments, math surveys, domain-general cognitive measures, and math-specific cognitive measures. Information about each of the measures is presented below.
Standardized Assessments
KeyMath 3 (Connolly, 2007) – The KeyMath 3 Diagnostic Assessment is a comprehensive, norm-referenced measure of essential mathematical concepts and skills. KeyMath content covers the full spectrum of math concepts and skills that are typically taught in kindergarten through tenth grade and can be used with individuals aged 4 ½ through 21 years who are functioning at these instructional levels. The instrument has three concept areas. From T5-T9, we administered three subscales out of the five in the Basic Concepts area.
- Numeration: This subtest measures an individual’s understanding of whole and rational numbers. It covers topics such as identifying, representing, comparing, and rounding one-, two-, and three-digit numbers as well as fractions, decimal values, and percentages. It also covers advanced numeration concepts such as exponents, scientific notation, and square roots.
- Algebra: This subtest measures an individual’s understanding of pre-algebraic and algebraic concepts. It covers topics such as sorting, classifying, and ordering by a variety of attributes; recognizing and describing patterns and functions; working with number sentences, operational properties, variables, expressions, equations, proportions, and functions; and representing mathematical relationships.
- Geometry: This subtest measures an individual’s ability to analyze, describe, compare, and classify two- and three-dimensional shapes. It also covers topics such as spatial relationships and reasoning, coordinates, symmetry, and geometric modeling.
Woodcock-Johnson Achievement Battery III (Woodcock, McGrew, & Mather, 2001) – The Woodcock-Johnson is a standard assessment of a range of skills, designed to be used with people ages 2 to 90+. We used the Quantitative Concepts subtest to measure students’ math knowledge during all years of the project. During T7 and T8 data collection, we also administered the Letter-Word Identification subtest, which provided information about students’ verbal abilities.
- Quantitative Concepts A & B: Quantitative Concepts has two parts and assesses students’ knowledge of mathematical concepts, symbols, and vocabulary, including numbers, shapes, and sequences. It measures aspects of quantitative math knowledge and recognition of patterns in a series of numbers.
- Letter-Word Identification: This subtest measures students’ ability to name letters and read words aloud from a list.
Comprehensive Mathematical Abilities Test (CMAT; Hresko, Schlieve, Herron, Swain, & Sherbenau, 2003 ) – The Comprehensive Mathematical Abilities Test (CMAT) was developed to assess a broad spectrum of mathematical abilities in the areas of comprehension (reasoning), calculation, and application. The instrument is comprised of six core subtests, as well as six supplemental subtests. Due to ceiling effects on the KeyMath-3, we used the CMAT as a replacement for KeyMath beginning at T10. Of the 12 CMAT subtests, we administered one core subtest (Subtest 5: Problem Solving) and two supplemental subtests (Subtest 7: Algebra, and Subtest 8: Geometry). These measures were selected because they mapped most closely onto the KeyMath measures that were given in previous study years.
- Subtest 5: Problem Solving (PS). The Problem Solving subtest measures a student’s ability to translate a problem stated in English text into a mathematical problem for ultimate solution. Problem situations are chosen from a broad cross-section of real-world situations. Included are items that require the manipulation of operations and combinations of operations, use of formulas, probability, or calculation of percentages and ratios. The use of a calculator is permitted on this subtest, which makes the computational items primarily a matter of understanding the nature of the problem rather than basic computational facility.
- Subtest 7: Algebra (AL). The Algebra subtest includes solving equations for a single unknown, simplification of polynomials, factoring polynomials, solution of quadratics by factoring and/or with the use of the quadratic equation, and solution of simultaneous linear equations. The use of a calculator is permitted on this subtest, which makes the computational items primarily a matter of understanding equations rather than basic computational facility.
- Subtest 8: Geometry (GE). Subtest 7 measures abilities in Euclidean geometry. Items measure concepts from plane geometry, area, volume, surface area, parallel lines, geometry of the triangle, and geometry of the circle. The use of a calculator is permitted in this subtest, which makes the computational items primarily a matter of understanding the geometric concepts rather than basic computational facility.
Nonstandard Math Assessments
- Functional Thinking – Developed by Bethany Rittle-Johnson (items taken from Lee, Ng, Bull, Pe, & Ho, 2011), this task consists of 6 ‘tables’ in which the student has to fill in the missing Input number, Output number, and Rule. The maximum possible score is 18 (3 points per table). Two function rules are addition, two are multiplication, and two are multiply-then-add. Functional Thinking was administered to students during T5 and T6 data collection.
Click here to view a copy of the Functional Thinking assessment.
Math Surveys
Student’s Feelings About Math (FAM)
In the first year of the Middle School Follow-Up Study (T5), we adapted a student survey from Karabenick and Maehr’s (2007) MSP Motivation Assessment Program. Students were asked 10 questions about how much they liked math, how good they were at math, how much they felt like their math teacher cared about them, etc. Responses were on a 5-point scale. The results demonstrated little variability in student responses.
Trends in International Mathematics and Science Study (TIMSS)
To address concerns with the FAM survey, we replaced FAM with the TIMSS beginning with T6 data collection (Martin, Mullis, & Foy, 2008; Mullis, Martin, Foy, & Arora, 2012). The TIMSS Math was administered at every subsequent assessment timepoint, and at T10, we also began administering the TIMSS Science.
For the TIMSSS Math, students were asked 26 4-point-scale questions (i.e., Agree a lot, Agree a little, Disagree a little, Disagree a lot) about how they feel about math, including how much they enjoy doing math, how well they think they are doing in math, etc. While the TIMSS Math asks students very similar questions (and a greater number compared to the 10 FAM questions), students were asked to circle their answers on paper rather than respond verbally. This process was adopted to provide students with a greater sense of confidentiality as they responded.
The TIMSS Science asks similar questions to the TIMSS Math, but the content is science-focused instead of math-focused. The TIMSS Science also includes one additional question (“I read about science in my spare time.”) that is not included on the TIMSS Math.
Both the TIMSS Math and the TIMSS Science provide national and international comparison data.
Click here to view a copy of the Feelings About Math survey.
Click here to view a copy of the TIMSS Math survey.
Domain-General Cognitive Measures
- Backwards Corsi Blocks (Vandierendonck, Kemps, Fastame, & Szmalec, 2004) – This task involves a student’s working memory. Different numbers of squares light up in a sequence, and the student must then tap the squares in the reverse order from which they lit up. The task consists of 16 total trials made up of 8 2-trial items. The sequence length of squares increases from 2 to 8 across the activity. The score of interest for this measure is the highest span reached, or the longest sequence length that the student was administered and got at least 1 correct (span with at least 50% accuracy). Corsi Blocks was administered to students during T5, T6, and T8 data collection.

- Hearts & Flowers (Davidson, Amso, Anderson, & Diamond, 2006) – This task tests a student’s attention shifting and inhibitory control skills. Students are instructed to use the number pad to select either the congruent or incongruent side of the screen based on the following stimuli and rule combinations:
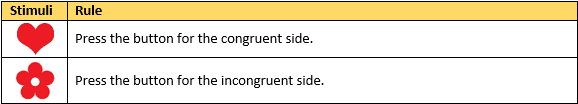
The Hearts & Flowers task consists of 12 congruent trials, 12 incongruent trials, and 48 mixed trials. It was administered to students at T5, T6, T7, and T8 data collection.
Math-Specific Cognitive Measures
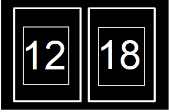
- Symbolic Number Comparison (Roussell & Noël, 2007) – This task assessed students’ Approximate Number System (ANS) acuity through the simultaneous presentation of two single-digit numbers. Before T6 data collection, the task was modified so that two double-digit numbers were presented. Students were required to select via button press which of the two numbers was larger. Scores of interest for this task include the total percent accurate (mean and slope across ratios of the two presented digits), response time for correct responses (mean and slope across ratios of the two presented digits), and a Performance score, which includes both response time and error rate. This task was given to students at T5, T6, T7, and T8 data collection.
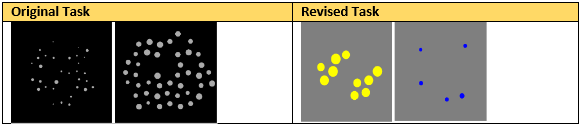
- Nonsymbolic Number Comparison (Roussell & Noël, 2007) – This task presents two arrays of dots simultaneously and requires the student to determine which side of the screen contains more dots. Scores of interest for this task include the total percent accurate (mean and slope across ratios of the two presented arrays), response time for correct responses (mean and slope across ratios of the two presented arrays), and a performance score, which includes both response time and error rate.
In T5, this task was administered to all students, and then a slightly modified task was given to roughly half of the students, starting in the middle of the assessment period.
For T6 and T7, only the modified task (‘Color Dots’) was administered. The task was not given following T7. In the modified task, two arrays of dots were presented simultaneously, one on the left side of the screen containing yellow dots and one on the right side containing blue dots.
Example stimuli from the original and revised tasks are shown below.
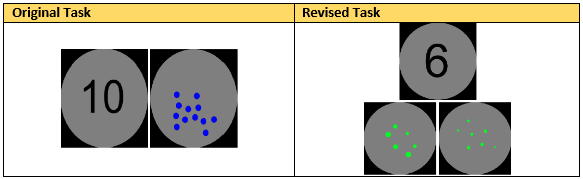
- Nonsymbolic and Symbolic Number Comparison (Lyons, Ansari, & Beilock, 2012) – This task was introduced for T6 data collection, and a modified version of the task was administered to students during data collection at T7 and T8. Students were presented with a symbolic number and nonsymbolic numerosity (i.e., a set of dots) and were required to select which of the two simultaneously presented stimuli represents the larger quantity.
During year 3 (T7) of the Middle School Follow-Up Study, the task was revised, and this revised task was also given during T8 data collection. In the revised task, students were first presented with stimuli consisting of a symbolic number at the top of the screen and two nonsymbolic numerosities at the bottom of the screen. They were instructed to select via button press which of the nonsymbolic numerosities matched the symbolic number. For the second half of the task, the stimuli were changed to show a nonsymbolic numerosity at the top of the screen and two symbolic numbers at the bottom of the screen. Students were instructed to select via button press which of the symbolic numbers matched the nonsymbolic numerosity at the top of the screen.
Example stimuli from the original and revised tasks are shown below.
- Numeral Ordering (Lyons & Ansari, 2015; Lyons, Price, Vaessen, Blomert, & Ansari; 2014) – Numeral Ordering was administered during T8 data collection. For the first half of the task, students were instructed to indicate via button press whether or not a sequence of one-digit numbers was presented in order from left to right. During the second half of the task, students were shown two-digit numbers and asked to indicate whether or not they appeared on the screen in order from left to right.
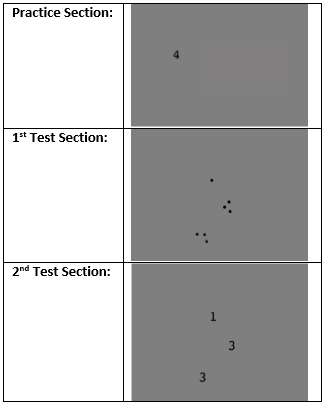
- Nonsymbolic Enumeration Fluency (Starkey, 2014; Starkey & McCandliss, 2014) – This task was given at T5 and T6. It is comprised of a practice block, as well as two primary test components.
Before the test trials began, students completed 27 practice trials in which they were asked only to press the number on their keypad that matched the numeral on the screen; this was done to prime students for this method of responding.
During the first test section, students were presented with collections of dots to be enumerated under instructions for speeded responses. Students were presented with 64 (T5) or 76 (T6) trials in which they were instructed to rapidly indicate via button press the exact number of dots presented simultaneously on a computer screen. Arrays ranged from 1 to 9 in set size. Dot size, density, perimeter, and surface area were varied so as not to provide accurate cues to numerosity. Primary scores of interest from this measure are accuracy and response time (for correct responses only) means and slopes of median response times across set sizes for random presentations of 1-3 (an indicator of subitizing ability), and random presentations of 5-7 and grouped presentations of 5-7 (the contrast of the two indicates a student’s groupitizing skill).
In the second test section, students were presented with 24 (T5) or 40 (T6) screens that had 2 or 3 numerals on them, and the student had to press the corresponding number key indicating the sum of the numbers on the screen. Sums ranged from 5 to 9.
Example stimuli from each section of the task are shown below.