GNUplot Tutorial
Gnuplot is an open-source command-line program. It generates 2D and 3D plots of functions, data, and data fits. The latest version can be downloaded for free from the following sites:
https://sourceforge.net/projects/gnuplot/
When installing gnuplot, be careful to de-select any useless items like Yahoo! toolbars or other ad-ware. You will also need a basic text editor for creating and editing data files: Notepad (Windows), TextEdit (Mac), or emacs (Linux). You probably already have this on your computer.
Install gnuplot on your machine, then work through the following exercises to gain a basic working knowledge of the environment.
_______________________________________
Plotting Functions
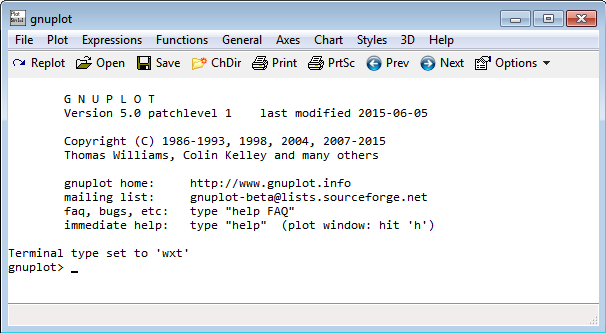
Open gnuplot. Do not use the console version; you should see a screen like this.
At the prompt, enter the following commands and see what happens:
plot sin(x)
splot sin(x) Using the mouse, grab the plot and move it around.
plot sin(x), cos(x)
splot sin(x) + cos(x)
plot exp(-x)
With the up-arrows on your keyboard, you can recall previous entries and edit them.
You can also define variables and functions. Note that gnuplot uses ** to raise a number to a power.
a=2
b=4
c= -8
f(x)= a*x**2 + b*x + c
plot f(x)
c=-300
plot [x=-6:10] f(x)
set yrange [-400:-100]
replot
Of course, plots need labels
set xlabel ‘x’
set ylabel ‘y’
set title ‘example plot’
replot
Common functions are listed below
Function Returns
abs(x) absolute value of x, |x|
exp(x) exponential function of x, base e
sqrt(x) the square root of x
cos(x) cosine of x, x is in radians
sin(x) sine of x, x is in radians
tan(x) tangent of x, x is in radians
log(x) log of x, base e
log10(x) log of x, base 10
Working With Files
You can save your work to a file load it again the next time you run gnuplot. First, in the gnuplot window, select File / show Current Directory. This indicates which directory gnuplot is using. You may change it as necessary.
In the gnuplot window, select File/Save, then give your work a name: filename.plt
You have to enter “.plt” extension yourself. You can now close and then restart gnuplot. Then, from the File menu, you can open your saved work.
Data can be imported from a text file. You can create a text file using a text editor: Notepad (PC) or TextEdit (Mac). Open your text editor, then cut and past the following into it.
#time (sec) distance (m) uncertainty (m)
0 0.00 0.001
1 0.25 0.1
2 0.40 0.05
3 0.75 0.4
4 1.25 0.2
5 1.30 0.3
6 1.55 0.33
7 2.05 0.1
8 2.20 0.6
The # indicates a comment line. Any line starting with # will be ignored by gnuplot. Save this file to your current directory as example.txt. Then enter the following in gnuplot.
plot ‘example.txt’
Your previous range settings may still be active. From the plotting toolbar . . .

select the autoscale tool, then replot.
To include the error bars . . .
plot ‘example.txt’ with yerrorbars
Let’s consider a more complicated data file. Copy the following to a text file ‘example2.txt’.
#x y1 y2 errorx errory1 errory2
0 0.00 1.10 1 0.01 0.03
1 0.25 1.20 1 0.1 0.2
2 0.40 1.50 1 0.05 0.05
3 0.75 1.65 1 0.4 0.3
4 1.25 2.30 1 0.2 0.1
5 1.30 2.30 1 0.3 0.4
6 1.55 2.65 1 0.3 0.2
7 2.05 2.90 1 0.1 0.2
8 2.20 3.20 1 0.6 0.3
Enter the following commands
plot ‘example2.txt’ using 1:2:4:5 with xyerrorbars
plot ‘example2.txt’ using 1:2:4:5 with xyerrorbars, ‘example2.txt’ using 1:3:4:6 with xyerrorbars
Fitting Data to a Function
Let’s fit the data in example.txt to a line. Define the following function
m=1
b=1
g(x) = m*x + b
plot g(x), ‘example.txt’
Now, we will use gnuplot to adjust the variables m and b to fit the data inexample.txt.
fit g(x) ‘example.txt’ via m,b
replot
Consider example2.txt. Here, we must tell gnuplot exactly what data to fit.
fit g(x) ‘example2.txt’ using 1:3 via m,b
plot ‘example2.txt’ using 1:2:4:5 with xyerrorbars, ‘example2.txt’ using 1:3:4:6 with xyerrorbars, g(x)
Further Help
This tutorial is just enough to get you started. Much more help is available online.
- http://www.gnuplotting.org/plotting-functions/
- Beginner tutorial from http://www.usm.uni-muenchen.de/people/puls/lessons/intro_general/gnuplot/gnuplot_for_beginners.pdf
- http://people.duke.edu/~hpgavin/gnuplot.html
- http://brothersbloom.blogspot.com/2013/11/gnuplot-tutorial-for-beginners-on-linux.html
- http://physics.ucsc.edu/~medling/programming/gnuplot_tutorial_1/index.html
- http://www.sunsite.ualberta.ca/Documentation/Gnu/gnuplot-3.7.1/html_node/gnuplot_toc.html#TOC1
Connect with Vanderbilt
©2024 Vanderbilt University ·
Site Development: University Web Communications