Quantitative evaluation of the tractography results will be performed using 3 base metrics (for sub-challenge #1 and #2):
(1) A voxel-wise bundle overlap measure [3]. The proportion of voxels within the ground truth volume that are traversed by tractography streamlines. This value describes how well the submitted tractography algorithm is able to recover the volume of the true white matter bundle.
(2) A voxel-wise bundle overreach measure [3]. The fraction of voxels containing a tractography streamline outside the volume of the gold standard bundle divided by the total number of voxels in the gold standard bundle. This value describes the extent that tractography extends beyond the valid white matter bundles.
Together, these metrics will quantify volumetric overlap of tractography with the true white matter pathways, and answer the question “how well does each challenge submission describe the overall bundle geometry?”.
For Histological Analysis (sub-challenge #2 and #3), the following evaluation metric will be implemented:
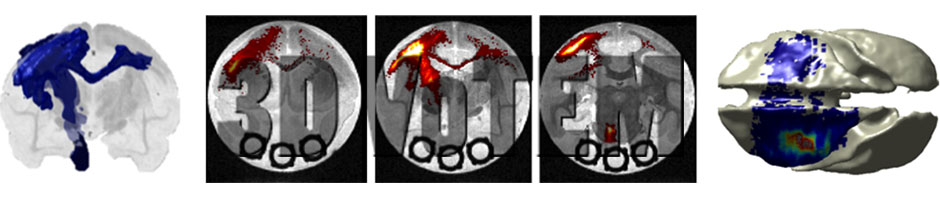
(3) A region-of-interest based sensitivity and specificity score (as described in Thomas et al., PNAS 2014). These values will be calculated based on the presence or absence of tractography and tracer tracts on a larger spatial scale (10’s to 100’s of voxels), with regions identified based on an existing squirrel monkey atlas (sub-challenge #2) or an existing macaque atlas (sub-challenge #3).
Together, these metrics will allow us to ask how different technical parameters affect the anatomical accuracy of the tractography techniques in terms of sensitivity and specificity, as well as assess the prevalence of false-positive and false-negative tracts at differing spatial scales. Further analysis will probe problematic areas for each algorithm in order to determine where and why misalignment of tractography and tracer occurs. Potential reasons for misalignment could be due to user-defined technical parameters which stop tracking prematurely (e.g., low FA or high curvature), a low prevalence or density of the tract of interest, complicated neuronal fiber geometries (i.e. crossing, bending, or kissing fibers), or tractography propagation errors (i.e., long tracking distances).
All entries submitted in time will be ranked by all three metrics. The entry with the smallest sum of ranks will be the winner.
While overall winners are determined only based on the above criteria, upon submission one can be considered for sub-categories based on the number of diffusion weighted images (<=30, 31-96, 97+) and b-value (single shell v.s. multi-shell) for the anisotropic phantom. Categories will be shown on the leaderboard, and host website will allow filtering by category.
Secondary evaluation will be:
(A) A voxel-wise sensitivity and specificity score. These values will be calculated from the number of valid, or true positive, voxels (those containing both tracer and tractography tracts), as well as the number of invalid, or false positive, voxels (those containing tractography, but NOT tracer tracts).
(B) a Hausdorff distance between bundles the polyline interpolation of points to quantify error between tracer and tractography as a distance metric.
(C) For probabilistic algorithms, we will calculate a correlation between the probabilistic score and the BDA fiber density in order to determine if a relationship exists between tractography confidence measures and white matter densities.
Finally, because the Anisotropic Diffusion Phantom has multiple, known, connections, we can calculate several global connectivity metrics as in [3]. This includes valid bundles, invalid bundles, and no connections.
All code for evaluation will be made freely available. This will enable researchers to reproduce results, as well as a benchmark from which to design and evaluate new state-of-the-art algorithms.
WINNERS
There will be a “winning group” for each sub-challenge, as well as an “overall winner”.
Submissions for each challenge will be ranked for each metric, the winner of each challenge will be the group with the lowest average rank for each metric.
The “Overall Winner” will be the group with the lowest overall rank across ALL 3 SUB-CHALLENGES.
*Groups do not have to submit to all three challenges if you do not want to. HOWEVER, to be the Overall Winner, you must present a submission for all three sub-challenges.
Synaptive Medical is offering a 3D anisotropic diffusion phantom as a prize in this challenge. This unique phantom, with housing shape and size suitable for standard MR head coils, mimics the brain’s fascicles using simulated fiber bundles with quantifiable anisotropy.
The phantom was designed to support the utility and application of DWI as a diagnostic decision-making tool for researchers and clinicians. It bio-mimics a temporally stable neuro-architecture and allows for standardized and rigorous assessment across systems and image processing software to improve reproducibility and temporal stability (i.e., to be used as the ground truth).
