Archive
Notes Archive
Selection of previous course topics to give an idea of what the club has to offer
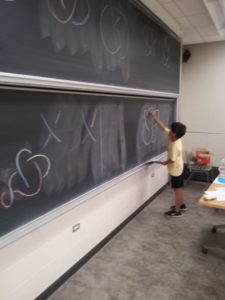
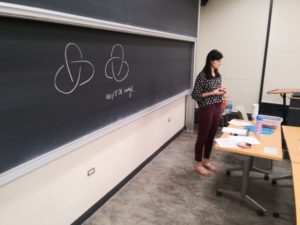
November 17, 2020:
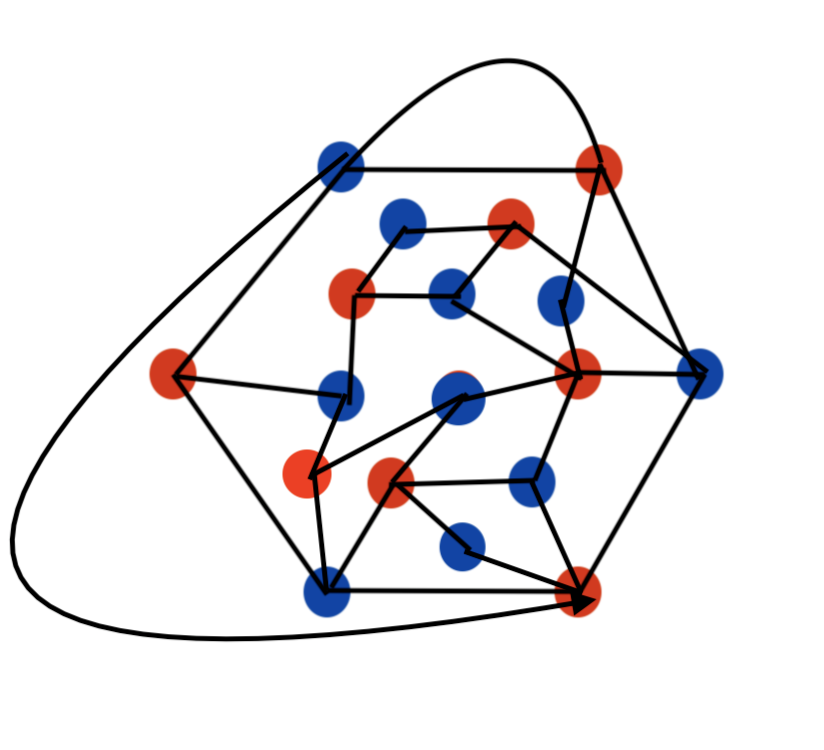
In the middle school group, students learned more about graph theory from a different perspective.
The high school group had a guest lesson by Robert Schneider from UGA, who taught about the famous quaternions. These strange numbers were discovered by Hamilton. They are a special four dimensional version of the complex numbers, which Hamilton found after the realization that such a structure can’t exist in three dimensions. These are strange in that they are no longer commutative, that is, x*y is not always y*x. However, they have lots of interesting applications, and are regularly used today for computer graphics and in video games.
October 20, 2020:
In the middle school group, students learned more about graph theory, continuing the lesson from the previous session. Slides are here: Math_Club_Graphs2
In the high school group, students learned about exotic fractions called Egyptian and continued fractions. They saw that these can be used to solve puzzles, and to split up pizza. They also saw that simple questions about these quickly lead to problems that no mathematician today knows how to solve. Studying the so-called continued fractions, they worked on a method which produces extremely close approximations to any number using as simple as fractions as possible. In particular, they saw a beautiful formula for pi, which allows you to give it to as much accuracy as you want, and all you have to know are the squares of odd whole numbers: 1,9,25,49,81…
Slides of what was covered are here:MathCircleContinuedFractions
October 6, 2020:
The middle school group took a look at graph theory and its applications in solving some famous puzzles. More applications and examples will be discussed at the next meeting. The first set of slides is here: Math_Club_Graphs1
The high school group studied a fun and surprising problem called the Uncut Spaghetti problem. The slides are here: High_School_Math_circle__Uncut_spaghetti
September 22, 2020:
In the middle school group, we worked on two seemingly very different problems: one about tiling and one about fractions. By the end we will discover a surprising connection between them.
In the high school group, we studied a simple-sounding, but not so easy question: which numbers are the sums of two perfect squares? Along the way, we learned about complex numbers, the Gaussian integers (complex numbers with integer coordinates), and primes in the Gaussian integers.
Slides are here: MathCircleGaussianIntegers
September 8, 2020
Returning from our Covid hiatus, we started the online Fall semester.
The middle schoolers learned that fractions, though much maligned, have many interesting properties. They learned about exotic fractions studied, for example, by the ancient Egyptians. They saw that these fractions can be used to solve puzzles, and to split up pizza. They also saw that simple questions about these quickly lead to problems that no mathematician today knows how to solve. Studying the so-called continued fractions, they worked on a method which produces extremely close approximations to any number using as simple as fractions as possible. In particular, they saw a beautiful formula for pi, which allows you to give it to as much accuracy as you want, and all you have to know are the squares of odd whole numbers: 1,9,25,49,81…
Slides of what was covered are here:
In the first part of our high school lesson, we discussed the Chicken McNugget problem. The idea of the problem is that if I am able to buy McNuggets in packs of 5, 7, and 11, what number of chicken McNuggets am I able to purchase? In this case, the answer turns out to be any positive integers with the exceptions of 1, 2, 3, 4, 6, 8, 9, and 13. This phenomenon of there only being finitely many numbers that are left out is very general, and the students came up with conjectures as to what numbers do or don’t occur. For the second part of our lesson, we discussed the use of SITESWAP notation in juggling. This mathematical way of denoting a juggling pattern has allowed jugglers to create new techniques. Moreover, we were able to illustrate the juggling patterns using a fun online tool: http://www.gunswap.co/#
February 25, 2020:
The middle school group had a great time learning about the mathematics of the game KenKen. This is similar to Sudoku, in that there is a 9×9 grid and it has to be filled in so that each row and column has the numbers 1-9. However, unlike Sudoku, there are extra blocks drawn inside the grid with extra restrictions such as that the numbers in that block must add, subtract, divide, or multiply to be some displayed number. These more complicated rules give rise to more mathematical phenomena, and a wide type of puzzles with different strategies.
In the high school group, we studied codes and cryptography. Students learned about some historical examples, and some basic methods. Students then got some practice in code-breaking, and learned how codes that send all the letters to one other letter or symbol in a predictable way are easy to break given a large enough sample set using frequency analysis. Students then discussed how one could make better codes which are not so easy to break, and we discussed a few of the methods which are used in modern cryptography to secure internet data, credit cards, etc.
February 11, 2020:
The middle school group played games and learned some of the surprising mathematics behind hat problems:
The high school group looked at Ferrers diagrams of partitions, which are a convenient way to prove identities for partitions (ways of breaking up positive integers into sums of smaller integers) using symmetry. Student learned about a recursive formula for partitions due to Euler, which allows one to compute partition numbers efficiently, and the pictorial proof behind this, which has been described as “the first great piece of American mathematics”.
January 28, 2020:
The middle school group learned about some basic set theory and counting problems. In particular, they studied some Venn diagrams, as well as the principle of inclusion-exclusion.
The high school group delved into the popular card game of SET, learning about some of the deeper mathematics behind this game of patterns.
January 14, 2020:
In the middle school group, we learned all about fractals. Students learned how to draw many examples of fractals themselves, which have the property that they are defined by simple rules but after many repetitions these simple rules give rise to complicated, chaotic patterns. For example, students learned about the Koch snowflake, the Sierpinski triangle, and many more exotic examples. Students also learned about how fractals are useful in the real world, for example in human lungs, and discovered for themselves that they can have crazy properties like having finite area but infinite perimeter, and non-whole number dimensions! We also had fun watching a video of zooming in on the Mandelbrot set; a quick Google search yields many cool videos. Finally, students used their creativity and made some of their own fractals to show to the class.
In the high school group, students played the game of KenKen, which is a lot like Sudoku, but with extra restrictions. Students learned some techniques for solving these puzzles, and worked on problems of increasing difficulty. Students also saw that the extra rules in KenKen sometimes give rise to deeper problems that depend on concepts such as number theory.
October 29, 2019:
In the middle school group, we learned about the Pigeonhole Principle. The idea is simple, but the consequences are surprisingly deep. The basic idea is that if you have 10 pigeons for example, and suppose its raining and each of these pigeons must nest in one of 9 pigeonholes, then at least one of those holes must have more than one pigeon in it. For example, if there are 400 people in a room, the people can be thought of as the “pigeons”, and if the “holes” are birthdays, then there are 365 holes. Since 400 is larger than 365, two pigeons must be in the same hole, in this case, at least 2 people in the room must share a birthday. More generally, you can say that a certain number of pigeons must be in each box. For example, if there are 80 people in a room, then if they are put into 12 boxes, and you assign to each person their month of birth, then 80/12=6.666 which rounds up to 7, and the Generalized Pigeonhole Principle then says that at least 7 people in the room were born in the same month. This is what is needed to guarantee that people share a birth month or birthday no matter what; we also briefly talked about the Birthday Paradox, which is a probability question. With only 23 people in a room, even though there are 365 possible birthdays (for simplicity), then there is already a more then 50% chance that two people share a birthday. We actually ran this experiment and found that there were two pairs of people sharing a birthday (two were twins, though the other pair were not). The pigeonhole principle is a very important topic in mathematics, and can. be used to solve many tricky problems. Indeed, it is often useful in competition mathematics, and even is used in college level and published mathematical research. In the lesson, students learned to identify pigeonhole problems in a number of different situations, and worked in teams to solve a variety of problems of increasing difficulty.
In the high school group, we played a game of math Jeopardy! These included challenging problems from various areas of math, and students played on small teams. There were also two math books (expository popular books) given as prizes to the winners.
The problems we covered are here: High_School_Math_Circle_Jeopardy
October 15, 2019:
In the middle school group, students worked with a map of the United States and tried to color all the states in a way that no two bordering states share the same color, and using the fewest colors possible. By trial and error, we agreed that more than 3 colors are needed, and that 4 colors suffice. Students discovered the reason for needed at least four colors by analyzing states and whether they border an even or odd number of states. We then had students attempt to come up with their own maps which require a certain number of colors. No one was able to find a map which needs 5 colors, and for good reason! A very difficult result in modern mathematics is known as the 4 color theorem, and it says that any flat map only needs 4 colors to fill in. Then, we learned about coloring graphs, and which graph colorings correspond to map colorings. Finally, we contructed Moebius strips out of paper, and students discovered that on other shapes like a Moebius strip, there are maps that need more than 4 colors to completely fill in.
In the high school group, we studied mathematical voting theory. We learned about a surprising theorem called Arrow’s Paradox, which says that there is no possible voting system which is guaranteed to be completely “fair” in every situation (for example, there is no dictator voter who gets to solely decide every election). Students then learned about and did some experiments with alternative voting systems rather than simple majority rules, including schemes which allow for more accurate representations of voter preferences in the right circumstances and which avoid the paradox of Arrow but are not guaranteed to always yield a clear winner.
October 1, 2019:
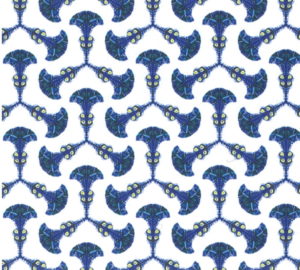
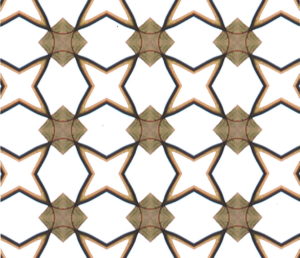
In the middle school session, students explored symmetry, and the different types of symmetries that can occur in wallpaper patterns. They learned to classify patterns by their symmetry, and worked toward seeing that there are only 17 distinct types.
For instance, students worked with the following patterns, both from “The Symmetries of Things” by Conway, Burgiel, and Goodman-Strauss:
In the high school group, we studied basic probability questions. For example, we studied the probability that in a hand of 5 cards you draw a full house, or a three of a kind. Students also had a preview of programming techniques on running simulations with 100,000 poker hand draws. We also learned about strange things that can happen in infinite probability settings, such as doing an experiment many, many times as the number of times approaches infinity. For example, we saw that if you go to a large fancy hat party and everyone leaves their hat at the coat check, but the coat check person loses the tickets and everyone has to pick a hat out of the bin at random, then the chance no one gets their own hat back is about 1/e. Here e=2.71828… is Euler’s number. We also saw the Buffon’s needle problem, which gives a way to estimate pi by dropping many “needles” or sticks and counting how many times they cross the lines on a grid. We attempted to do this experiment by dropping pencils. After some initial results showed that we had approximated pi by about 3, the numbers started to drift a little, but a repeat experiment with better sticks and a bigger grid, and with more data points, might help to get an approximation at least of pi as approximately 3.1. Several hundred sticks have to be dropped before getting a number for pi with confidence.
A good description of this weird phenomenon and an applet to simulate dropping 100’s or 1000’s of sticks can be found here: https://mste.illinois.edu/activity/buffon/ There, you can also approximate pi by virtually dropping other shapes, like triangles and circles as well.
September 17, 2019:
In the middle school group, we studied knots. Basically, these are knots like those you make when you tie your shoes or a bunch of wires get tangled up, but with the ends fused together. Students were given some knots made out of rope and discussed with their neighbors whether their knots are really the same or not. We discovered that it can be quite difficult to tell if two knots are the same, since sometimes they can look very tangled but a lot of the knot can be “undone”. For example, the unknot is a simple loop with no knotting whatsoever. Here are two pictures of the unknot, where the second one has two loops which can be “undone” by lifting it up. In these pictures, when there is a crossing, the line without a break goes over the strand with a break in it.

Although this example is relatively easy to visualize “undoing”, its actually a difficult problem to decide quickly if a knot is the unknot. For example, Professor Thistlethwaite from the University of Tennessee, Knoxville devised the following example, which is also “not” a knot:

This one is a little harder to visualize untangling to get the unknot! We discussed ways that we can tell knots apart. A powerful method is to use invariants, which don’t change if the knot just “looks” different. Our main example of this was the idea of tricolorability. Namely, we say a knot is tricolorable if each connected piece in the diagrams like above is colored with three colors with the following rules:
1). At least two colors are used (in particular, this means the unknot isn’t tricolorable).
2). At each crossing, the three strands all have the same color, or all different colors.
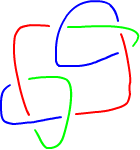
For example, here is a tricoloring of the granny knot:
But the figure 8 knot is not tricolorable, as at least 4 colors are needed to color it with the crossing rule number 2 above:
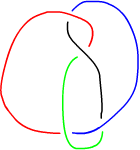
What does this tell us? Since being tricolorable is an invariant, it tells us that the granny knot is different than the figure 8 knot. Since the granny knot is tricolorable and the unknot isn’t, it also tells us that the granny knot isn’t the unknot. However, although the figure 8 knot and the unknot are both non-tricolorable, this doesn’t say whether those two are different. That is, if two knot have a different tricolorability property, we can say for sure that they are different, but if they have the same property, then this invariant doesn’t tell us one way or the other.
In general, this is a really tough problem. There is a lot of current research mathematics that goes into coming up with good invariants to study this problem. One of the most famous and useful ones is called the Jones polynomial, devised by our very own Professor Vaughan Jones here at Vanderbilt!
Here are a few pictures from the meeting:
In the high school group, we continued our study of prime numbers. In particular, we answered questions like:
1). How can we estimate how many primes there are up to 1 million? What about 1 trillion? Or 1 google?
2). How far can primes get apart?
3). Do primes infinitely often get close together (this is still an open problem after over 150 years!)?
4). On average, if I take a big prime number, how long should I expect to count until I find the next one?
5). There are the same “percent” of primes that are of the form 4n+1 as 4n+3. However, there seems to be a “bias” that there are usually actually more of the form 4n+3.
This is related to some pretty cool recent work of Robert Lemke Oliver and Kannan Soundararajan. It was proven just a few years ago that primes have a “repulsion” to certain patterns. For example, they “prefer” not to have end with the same digit in multiple primes in a row. As an example, if you look at the pairs of consecutive primes up to 100 million which end in the digits (7,7), then there are 4,439,355 of them, but there are 7,991,431 of those which end in the digits (9,1). Thus, the pattern of last digits (9,1) is about 1.8 times more likely to find than the pattern (7,7). In general, all the patterns which have two of the same last digits in consecutive primes in a row are less likely than those which have two different digits in a row. This was only discovered in 2016, and there are many more patterns of primes that are still completely unknown or unsolved that are still out there!
The slides from the high school lecture are here Prime Numbers Lesson Part 2
As a bonus, if you are a fan of the Hitchiker’s Guide to the Galaxy, you may be interested in some very exciting news about the number 42, and how a famous question about this number was just answered a few weeks ago by using an “earth-sized computer”. Here is a fun video about this news:
September 3, 2019:
In the middle school group, we studied magic squares, special arrangements of 3×3 grids with numbers that add up to the same value along any row, column, or diagonal. Students discovered what properties these squares must have, learned how to count the total number of them, found how to turn magic squares into new magic squares, and learned about “magic numbers”. Slides from this lesson can be found here: Magic_Squares
In the high school group, we studied prime numbers, the “atoms” of number theory. We studied questions such as:
How many prime numbers are there?
How can you build a table of all prime numbers up to 1000?
How many prime numbers are there of the form a*n+b for different choices of a and b?
Slides from this lesson, along with additional material on some cutting-edge questions on primes can be found in these slides: Prime Numbers Lesson
Take home problems for this lesson can be found here: HW_problemsHS1
April 15, 2019:
In the middle school group, we completed several hands-on experiments. We first learned about Möbius bands, doughnut shapes, and “Möbius bands” with multiple twists, and then build these out of paper and tape. We then asked questions like: what happens if you cut these shapes in half, and what would it be like to play tic-tac-toe on a Möbius band? We found some surprising results, and then figured out general patterns, such as how many pieces would you get if you cut a Möbius band with 100, or 101, twists, in half.
Here is a fun video showing the best way to cut a bagel with Möbius strips:
After the break, we made soap bubbles, and build different geometrical shapes like cubes and pyramids and learn about the mathematics of weird-shaped (such as cube shaped!) bubbles. Students made their own shapes to experiment with, and we found a bunch of interesting examples of “minimal surfaces”.
One last experiment that we didn’t have the time to do, but which can be carried out at home, is how to “compute” the number π=3.14… by dropping toothpicks. This is called the “Buffon’s Needle” problem. A fun simulation of this, which allows you to drop hundreds of thousands of sticks at once to see what the result would be, is here: https://mste.illinois.edu/activity/buffon/
In the high school group, we also studied doughnuts and Möbius bands. and continued our questions about coloring graphs on shapes like these. We then learned about Ramsey theory, which tells you that in many situations, if you have a large enough set of possibilities in some setup, then patterns must emerge. For instance, if you have a very very large set of text (such as a long novel) and go out looking for secret messages or predictions of the future in it, then you are guaranteed to find some “surprising” patterns. We studied a problem which many residents of the Prussian city of Königsberg tried to solve. Namely, they often on evening strolls tried to walk along each of seven bridges in the city exactly one time. After a while, they started to feel that it was impossible. We learned why it is impossible, and how to prove when similar puzzles are possible or not possible. Finally, we studied the problem of determining winners of a tournament with many different games among the players, and in different situations whether it even makes sense to declare one person as the “winner”.
April 1, 2019:
In the middle school group, we learned about codes and ciphers. We learned a bunch of ways to send secret messages, as well as techniques to crack codes. We also saw some funny ways of adding and multiplying numbers, “clock arithmetic”, which gave us the tools to study some examples.
Slides from the lesson, which includes some further puzzles to solve than we had time for in the session, are here: Cyrptography
In the high school group, we learned about properties of coloring maps. We started with a map of the US, and found by trial and error that 4 colors are enough to color each state so that no two states have the same color. Then we discussed what kinds of maps need at least 4 colors. We then tried to come up with maps that need at least 5 colors, but didn’t find any, as long as we followed certain rules, such as saying that countries to color on a map consist of only one piece and that countries coming together only at one point doesn’t count as a border. It turns out that there is a very very difficult theorem, the 4-color theorem, saying that this is indeed impossible to find a map which requires 5 colors. We then generalized the problem to coloring graphs, and saw that although the map coloring problem can be represented as a graph coloring problem, some graphs can’t be drawn in the plane without intersections, and so they don’t correspond to maps of countries on a flat surface.
We then started looking at the following take home problems, which, appropriately, include an April Fools’ puzzle of Martin Gardner: Take-Home Problems
February 25, 2019:
In the middle school group, first we reviewed the main topics from last class, to catch up the new students and looked at a game of Nim and determined which player would win and how that player would win using binary numbers. We covered some more combinatorial games including Gaskill Nim which is won using Fibonacci numbers, Thai 21 uses “mod 4” arithmetic, a game of 9-5, a game played with cards. We then looked at a Card Switching game and talked about using permutations, even and odd, to determine which player wins the game.
In the high school group, we continued learning about partitions. In particular, we learned about Ferrers diagrams, a pictorial way to play with partitions and to prove some useful facts about them. Then we learned about Euler’s Pentagonal Number Theorem, and how it helps us compute values of the partition function without actually having to find all the partitions.
The slides from the talk can be found here: PtnsPt2
Take home problems can be found here: problems2.25
February 11, 2019:
In the middle school group, the topic was how to use mathematics to improve a player’s chances of winning games. We talked about three characteristics of games- unknown information, chance and the moves available to the players. We focused on 4 purely combinatorial games, games with no chance and no unknown information. In particular we showed how a perfectly played game of Tic-Tac-Toe ended in a draw and then we played Daisy and Pennies on a Round and talked about how the player that created symmetry won. We then played Nim and talked about how we could use binary numbers to tell which player could create symmetry and how that player could create symmetry.
In the high school group, we introduced the idea of a generating function, and saw that it is a powerful tool for studying a sequence of numbers. For instance, we saw that some infinite sums really do make sense as finite numbers, and that 0.99999999…. really does equal 1. We also discovered an exact formula for the Fibonacci numbers, which allowed us to see why the Golden Ratio is closely connected to them. Finally, we introduced partitions, and started observing some strange properties of them, and asked the question as to how we would count the number of partitions of a large number without actually having to find them all.
Slides from this lecture are here: Lesson1
We also gave several take home problems, which can be found here: Problems2.11
January 28, 2019:
Topics:
In the middle school group, we introduced games of logic. We visited a mysterious island full of knights, liars, and occasionally tourists. Knights always tell the truth, liars always lie no matter what, and tourists, like regular people, lie sometimes and tell the truth sometimes. We solved various puzzles to determine who was what by their responses to different sorts of questions. We also played with craft “match sticks” and solved puzzles asking how to move only a given number of sticks to make certain shapes.
In the high school group, we covered a number of “proofs by picture”. We studied a number of summation formula, and gave proofs for the formulas for triangular numbers, the sum of the first n squares, and a geometric proof that the binomial coefficient with a 2 in the bottom is always a triangular number. We saw how geometric reasoning can be powerful and can lead to insightful proofs. We also worked on other puzzles, such as how to dissect an octagon into 5 pieces to obtain a square, and how to make a timer that measures out a very specific amount of time using unreliably burning fuses.
Here is a copy of the take home problems from the meeting: Take_home_problems_1.28
January 14, 2019:
Topic: Solving problems through coloring.
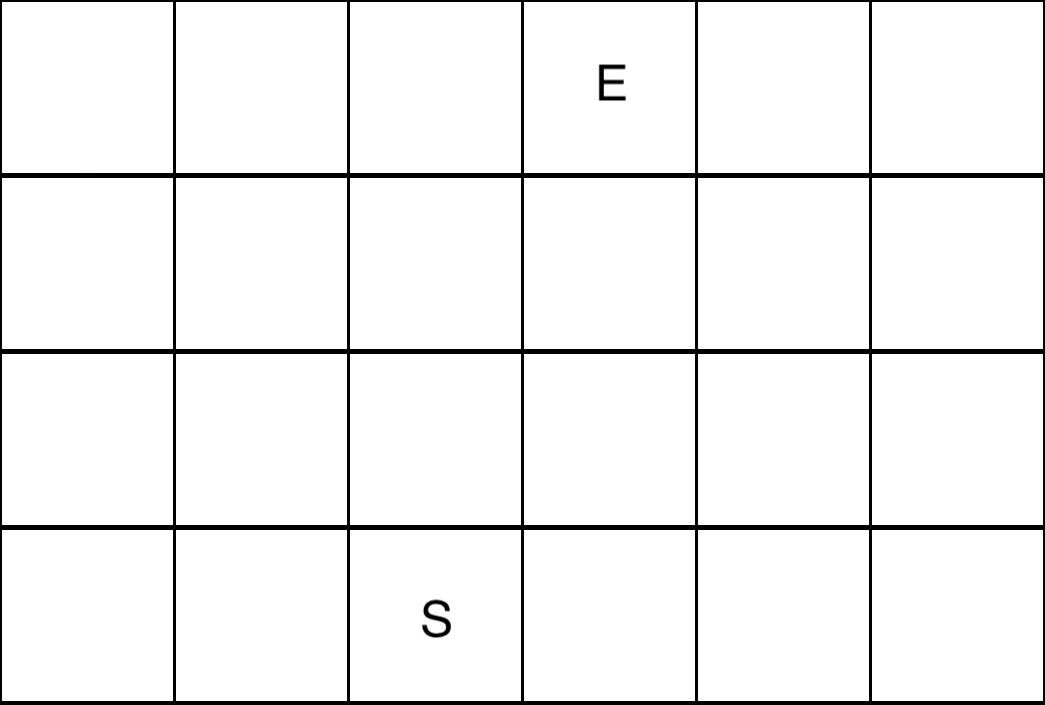
In this lesson, students had first introductions to problem solving and strategies about proving that certain things seem impossible in a completely convincing way. After introductions and several (mostly pun-based) warm-up problems, we asked if it was possible for “Sir Rick Cast-ley (OBE)” to run through rooms in his castle that starts in room “S” and ends up in room “E,” with the restriction that each room is visited exactly once (only left, right, up, down moves are allowed). Different possible positions of the start and end points were explored.
For example, our first problem considered:
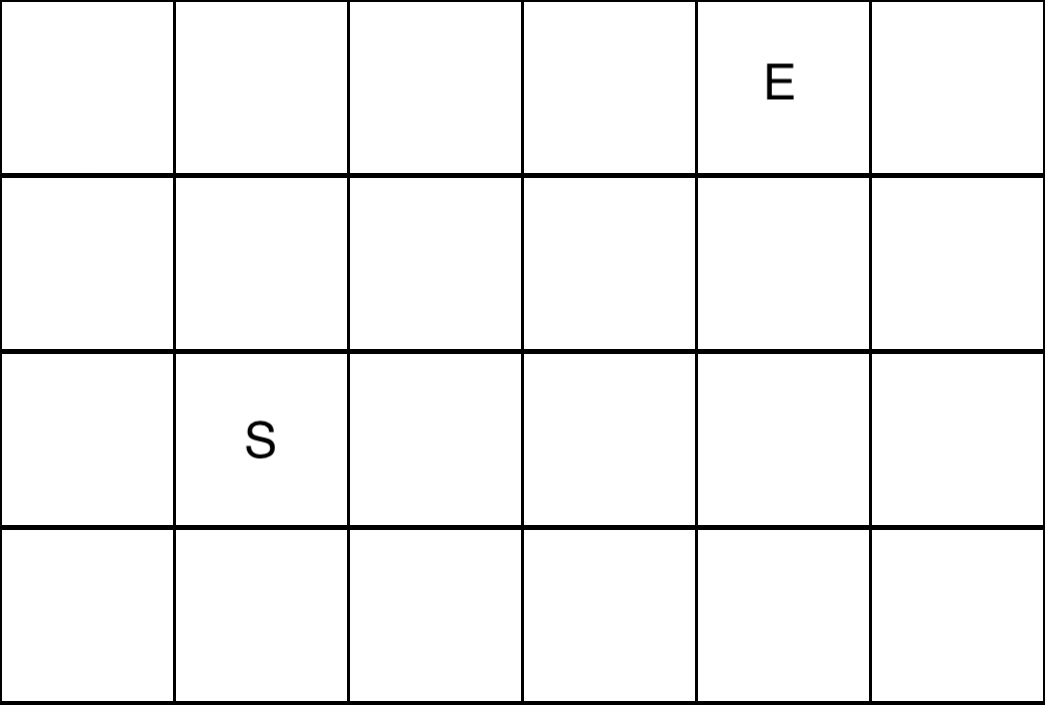
There are many ways to draw such a path (try for yourself!). As one student asked, a very nice question then is how many ways are there to solve it?
We then looked at more examples of these problems on the same grid but with different S and E points. By inspection, we found that sometimes it is possible, since you can just do it after a little experimentation, and sometimes after several attempts a solution was not found. As the students suspected, sometimes, like in the figure below, its simply not possible.
The question is why. There are only so many possible paths to draw, so certainly drawing out every possibility does show that, but this would be very difficult to write out, and it would be easy to miss a possible path. Also, if I looked at a 600×400 grid instead of a 6×4 grid, I could ask the same question, but clearly it wouldn’t be very fun to list all possible paths then! There must be a better way. Mathematics is, above all else, the study of patterns, and there must be a simple pattern with makes the first layout above different than the second one. As several student groups discovered by direct exploration, the pattern seems to depend on the following. If you walk the shortest possible way from the first to the last room and you end up passing through an even number of rooms, it seems solvable. If you passed through an odd number of rooms, on the other hand, it doesn’t look possible.
Try this yourself! After doing enough examples, you can quickly convince yourself that this seems true. We are on the right track, but observing the pattern is not enough; we need to show why the pattern works.
The key is to color the grid. For example, the two layouts above then look like the following. Suppose now that Sir Cast-ley has to go from his (V)ault to his (U)ndercroft.
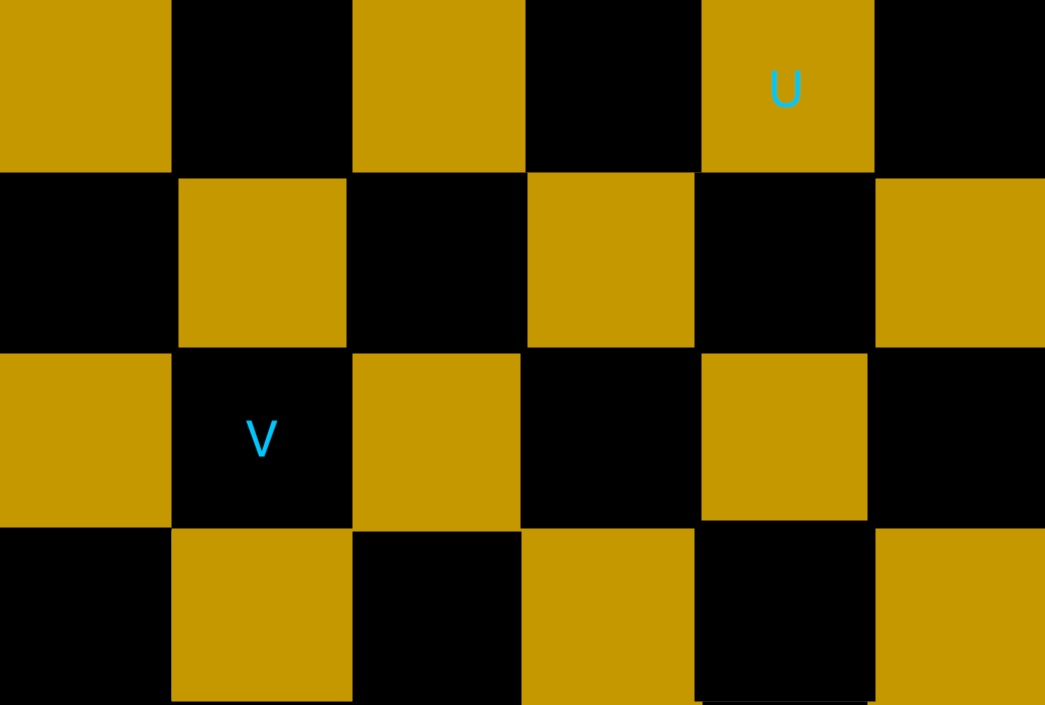
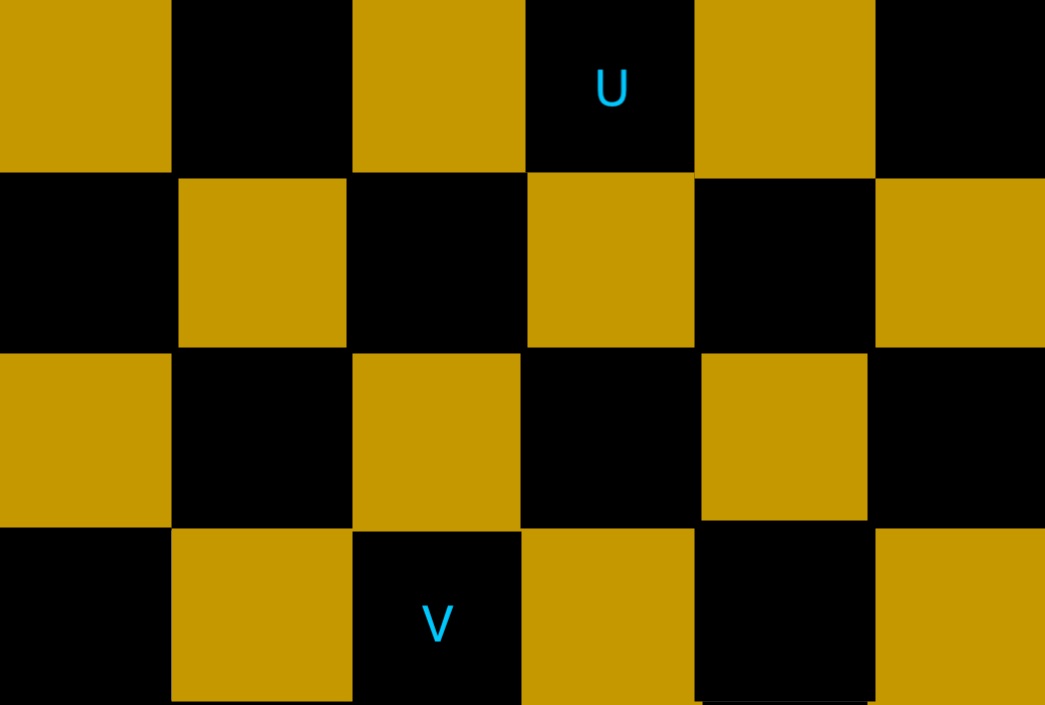
Now notice that every time you move between two rooms, the color switches. The pattern above can now be thought of in another way: it is the same as saying that the puzzle is solvable if the starting and end points are in rooms of different colors, and impossible to solve otherwise. How can we prove this new color version of our observation? Well, first note that there are 24 total squares, which is an even number. Thus, any path which hits each room exactly once is 24 moves long. By the color-alternating property, if you label the rooms as you go along the path by 1,2,…,24, then room 1 is the color of the starting square, let’s say gold for the sake of argument, and the color of a square is always the opposite of the next numbered one. For example, if 1 is gold, then the sequence of squares 1,2,3,… has colors G,B,G,… and so on. Thus, the color of the last room, room 24 with an even numbering, must be black, or the opposite color from the start point. This explains why if the colors are the same, then it is not possible.
This is a very powerful idea. It is our first example of an invariant: a path with an even number of steps on a checkerboard always must start and end in rooms of different colors.
After working through these examples, students worked through several further examples which can all be solved by coloring pictures with two colors, or by just “finding” the answer in some of the cases that were possible.
Students were given several take home problems to think about to reinforce the material. In addition, here are a few extra bonus problems to try out.
1). In the game Sudoku, players must fill a 9×9 grid such that the numbers 1-9 appear in each row, column, and in 9 special smaller 3×3 grids inside. Another type of problem like this is the following. Given an mxn grid, you want to fill it up with positive whole numbers so that every single row and column each adds up to 15.
Questions:
a) Show that m=n, i.e., that the grid must really be a square.
b) Find as many examples as you can of square grids which have this property and for which the diagonals also add up to the same number (they are called magic squares).
c) Can you find other nice examples with “15” replaced by other numbers?
2). Suppose that n is a positive odd number. Write down the list of numbers 1,2,…,n. Now pick two of them at random, say a and b, and replace them with the absolute value |a-b|. Keep doing this operation over and over until there is only one number left. Is the last number even or odd?
3). A map of a bunch of cities, represented as blobs, is below. There are various roads connecting cities. Is it possible to do a road trip which visits each city exactly one time?
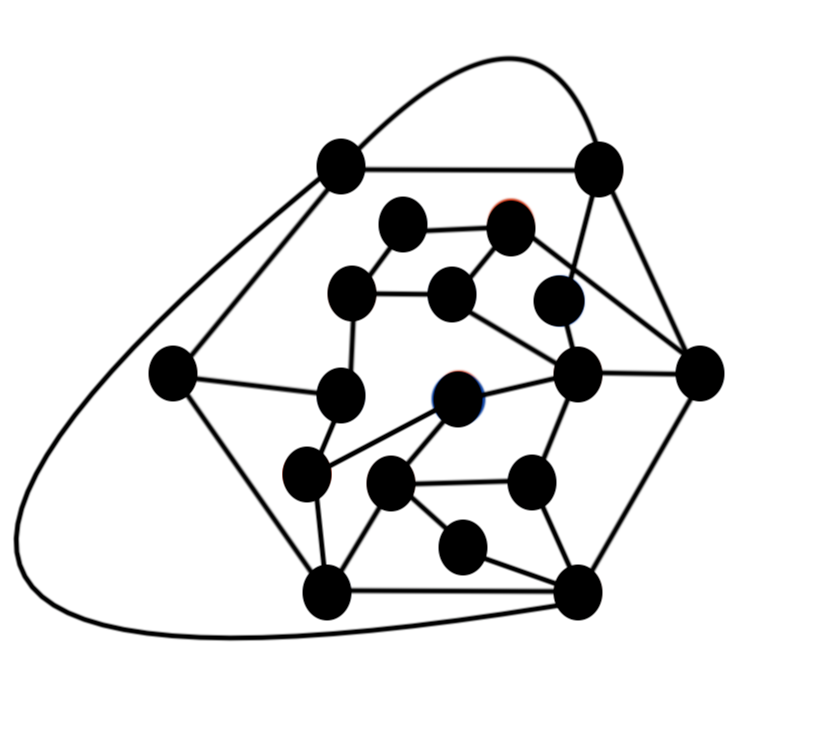
[If you need a hint, consider coloring the cities blue and red. If you need a stronger hint, then consider the coloring in the picture here.]