Data-Based Individualization Case Study Conclusion

Mr. Williams has created his progress monitoring plan and began implementing the instructional changes. He has collected four week of progress monitoring data and is examining his graph to see if the adaptations are increasing Joe’s reading fluency.
Let’s see how Mr. Williams uses the data from the new progress monitoring to evaluate the DBI process he has implemented with Joe.
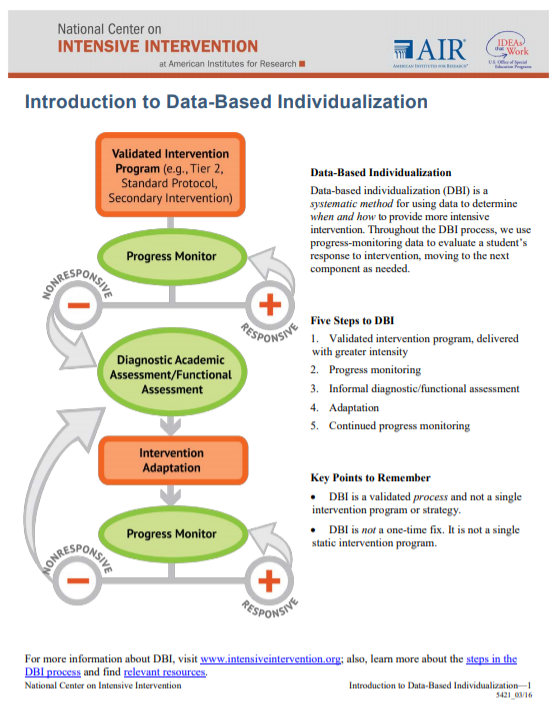
(Source: National Institute for Intensive Intervention)
After 4 weeks, Mr. Williams has collected fluency data on Joe using the validated progress monitoring tool. After looking at Joe’s graphed data for the 4 weeks, Mr. Williams sees that while Joe is increasing his words per minute, he is still not on track with the aim line.
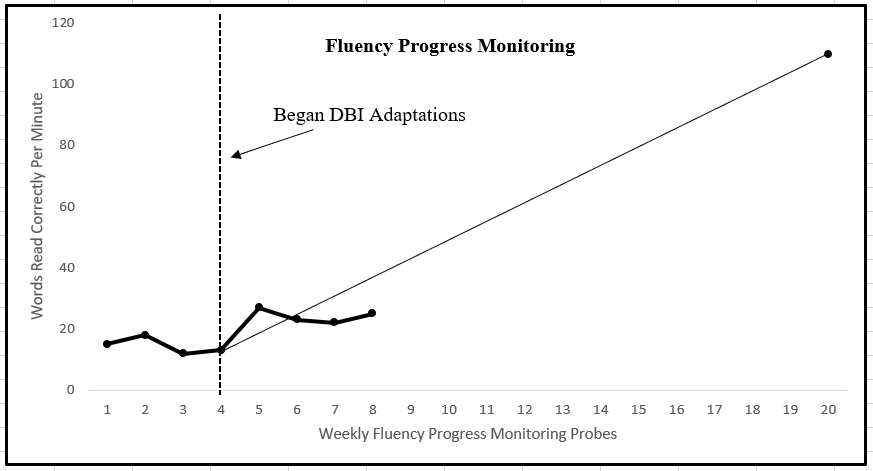
He determines that an additional change is needed. He looks at the progress monitoring data from the word reading fluency probes and sight word lists. He determines that Joe is making progress with the long vowel words but is still struggling with multi-syllabic words. Joe’s sight word fluency has increased, and Mr. Williams decides to target the words Joe is continuing to miss and still practice the know words with Joe, but only twice a week.
Mr. Williams has decided that the main change needed for Joe is another change in his intervention dosage. Mr. Williams wants to add additional minutes to his intervention time to increase instruction on multi-syllabic words. He also adds long vowel bingo that Joe must run. Joe will have to call out the words to Mr. Williams so that he can fill his board. Mr. Williams wants Joe to practice with whole word reading since he has increased his skills with decoding long vowels.
Mr. Williams takes another 4 weeks of progress monitoring data and notes that Joe only has one data point that falls below the aim line. His decision rule was that is 4 data point fell below the line, he will make another instructional change. Since only one point falls below the line, Mr. Williams will not make an instructional change.
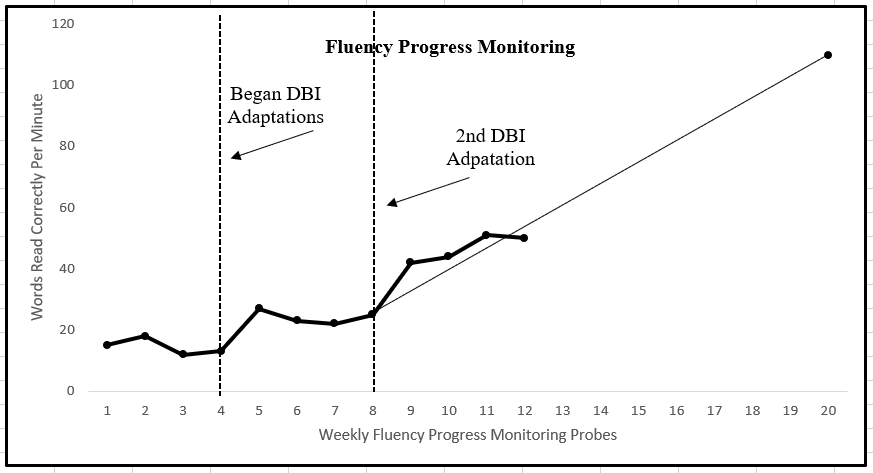
Mr. Williams will continue to monitor Joe’s progress monitoring data with the DBI process and make changes as needed. The DBI process is a cycle that is continuous. If an additional adaptation change would be needed, then Mr. Williams would begin the DBI process again.
Summary:
In conclusion, data-based individualization is a process of using data to inform instructional decisions for students who are nonresponsive to instruction. This process is not for every student, only those with intensive instrutional needs. DBI is not reinventing the wheel, it is using a validated instructional program and making adaptations to different areas to maximize the programs effectiveness. Data not only begins the DBI process, but drive the cycle. Data informs you of how the student is doing with changes and based on the decision rules you create, if changes are needed due to continued nonresponsiveness.
There are a number of resources to help you get started and train on the DBI process.
Click on one of the images below to access DBI resources.


References:
DBI Process Overview. (n.d.). Retrieved October 27, 2019, from https://intensiveintervention.org/resource/dbi-process-overview.