What’s that Sound?
Posted by John Vrooman on Thursday, February 20, 2020 in Major League Baseball, Sports Econ Blog.
There’s something happening here
What it is ain’t exactly clear…
There’s battle lines being drawn
Nobody’s right if everybody’s wrong…
What a field-day for the heat
A thousand people in the street…
Paranoia strikes deep
Into your life it will creep…
We better stop, hey, what’s that sound?
Everybody look what’s going down.
—Stephen Stills, “For What Its Worth.”
“After decoding the sign, a player would bang a nearby trash can with a bat to communicate the upcoming pitch type to the batter.”
—Robert D. Manfred, Commissioner of Baseball
Statement of the Commissioner / Athletic Article / PDF / Podcast /
At the beginning of the 2017 season, employees in the Astros’ video replay review
room began using the live game feed from the center field camera to attempt to decode and transmit opposing teams’ sign sequences for use when an Astros runner was on second base.
Once the sign sequence was decoded, a player in the video replay review room would act as a “runner” to relay the information to the dugout, and a person in the dugout would notify the players in the dugout or signal the sign sequence to the runner on second base, who in turn would decipher the catcher’s sign and signal to the batter from second base.
Approximately two months into the 2017 season, a group of players discussed that the team could improve on decoding opposing teams’ signs and communicating the signs to the batter. One or more players watched the live feed of the center field camera on the monitor, and after decoding the sign, a player would bang a nearby trash can with a bat to communicate the upcoming pitch type to the batter.
In August 2017, the Boston Red Sox were caught transmitting sign information from their replay review room to individuals in the dugout wearing smart watches.
At the outset, it is important to understand that the attempt to decode signs being used by an opposing catcher is not a violation of any Major League Baseball Rule or Regulation. Major League Baseball Regulations do, however, prohibit the use of electronic equipment during games and state that no such equipment “may be used for the purpose of stealing signs or conveying information designed to give a Club an advantage.
Major League Baseball Regulation 1-1 prohibits all uniformed personnel, clubhouse staff and equipment staff from using or possessing telephones or similar electronic devices, including any type of walkie-talkies, mobile phones, ‘smart watches’, laptop computers, tablets or other communication devices, in or near the dugout, in the bullpens or on the playing field once batting practice has begun.
The investigation uncovered no evidence that Astros players utilized the banging scheme in 2018. However, the Astros’ replay review room staff continued, at least for part of the 2018 season, to decode signs using the live centerfield camera feed, and to transmit the signs to the dugout through in-person communication.
At some point during the 2018 season, the Astros stopped using the replay review room to decode signs because the players no longer believed it was effective. The investigation did not reveal any attempt by the Astros to utilize electronic equipment to decode and transmit signs in the 2018 Postseason.
The investigation revealed no violations of the policy by the Astros in the 2019 season or 2019 Postseason.
Astros owner Jim Crane and his senior executive team spent their energies focused on running the business side of the Club while delegating control and discretion on the baseball side to (GM) Luhnow.
The comments in this paragraph relate only to the baseball operations department. This aspect of our investigation did not extend to the business side of the Club that functioned independently of baseball operations.
Jim Crane was unaware of any of the violations of MLB rules by his Club. In fact, Crane told Luhnow after the Red Sox discipline was announced that Luhnow should make sure that the Astros did not engage in similar conduct.
Robert D. Manfred, Jr.
Commissioner of Baseball
There’s Battle Lines Being Drawn
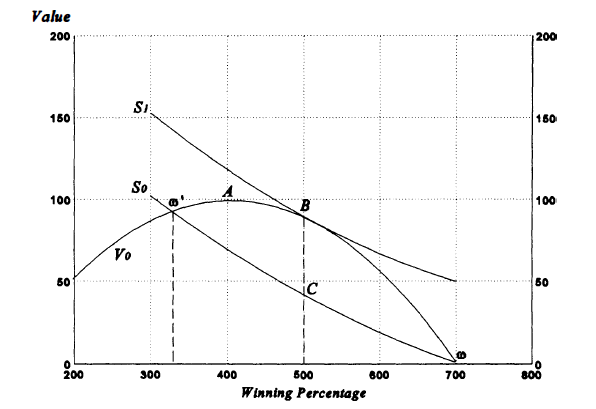
The graph above shows a hypothetical profit or franchise value function V for a typical MLB club (Value = PV of expected profit). A profit-maximizing owner would operate the club at the highest point of the profit/value function A, while a sportsman owner would trade profit or value for the satisfaction of winning and operate on the north face of the function at B. (Unified Theory)
The sportsman owner is sacrificing profit (vertical A-B) to win more games (horizontal A-B). Fans for the franchise would disregard foregone profit and prefer that their team was “in it to win it.” Fans and players would be most satisfied at the extreme max win / zero profit point of ω.
Sportsman club owners have the wiggle room to manipulate the team to satisfy their own personal preferences (shown as the family of S contour curves), because the monopoly club is playing in a league cartel with mega-monopoly power.
The downward slope of the S curves (contours) reflects a sportsman-owner’s willingness to trade profit for wins. Satisfaction contours shifting to the northeast (S0 to S1) reflect greater satisfaction overall.
In the extreme cases, a pure profit-max owner has a family of horizontal S curves heading true North, because only profit matters, while the avid fan-base has a set of vertical satisfaction contours heading due East, where only winning matters. All participants are constrained by the position and shape of value/profit function V, which are determined by a variety of factors affecting home-market size and labor-market power.
The operating range for the sportsman owner is between ω – ω’, because profits are negative above ω and winning no longer compensates for the profit loss below ω’.
Given this owner’s preferences and market size, satisfaction is maximized along S0 and minimized along S1. For team performance outside this operating range ω – ω’ the sportsman would sell the club in bankruptcy above ω, or bail-out for lack of interest below ω’.
If the markets and leagues were truly competitive, the club owners would be forced to run their teams at ω (minimum “normal profit” required to stay in the game) and maximize fan and player welfare. This shows the maximum social welfare (fans + players + owners) efficiency of open league competition and the gross inefficiency of monopoly closed league cartel power.
The more complicated problem in sports-league economics is that individual club performance is also constrained by the behavior of opposing teams involved in a zero-sum league (wins=losses). (Sportsman Leagues)
When a sportsman owner decides to sell the club for the maximum price (value) he would downsize the team by cutting payroll and moving the team from B back to A, when the team is on the market. Profit = revenue – costs, so increasing (decreasing) revenue more (less) than increasing player costs improves profit margins from either above or below profit max point A.
If a sportsman owner has several limited partners (Steinbrenner effect) or is highly leveraged (significant debt) then initially he would be more aggressive moving to the right past B, while playing with other peoples money. At sufficiently higher debt levels (HLT’s), the opportunistic owner would be forced back to B and ultimately to A as the level of debt rises. (This is the control function of debt in an LBO).
Ironically, the on-field rebirth of many teams in the 2010’s began from fiscal austerity forced by financial bankruptcy of owners surrounding the financial crisis of 2008. (e.g., Texas Rangers, Chicago Cubs, NY Mets). When a team is on the market, MLB owners usually cut team payroll by about 25 percent to maximize the franchise price (value) at the time of sale. (Unified Theory).
Everybody Look What’s Going Down
Baseball’s current tanking epidemic (the spread of deep payroll and roster cuts by several teams) is created on the supply-side from a segmented MLB labor market that has been arbitrarily split into three seniority groups since the inception of free-agency in 1976. (The Baseball Way)
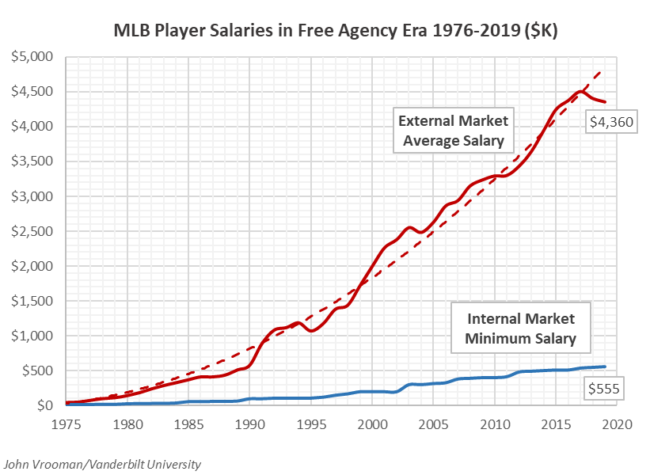
The baseball labor market has been segmented into three tiers of experience: Tier 1 (T1) = 0-2+ years of MLB service for players (a vestige of the former MLB player reserve system), Tier 2 (T2) = 3-5 years of service for arbitration eligible players, and Tier 3 (T3) free-agent players with 6 full years of MLB service. MLB players are under team “control” in T1 and T2.
On average T1 players are paid the minimum MLB salary which is roughly one-third of their marginal revenue product ($WAR), T2 players are paid about two-thirds of their MRP (marginal revenue product) and T3 players are over-paid about a third more than MRP or $WAR (team revenue $ produced above a minor league player).
Since the beginning of free agency in MLB (1976), exploitation of Tier 1 talent has been justified by MLB as player development cost recovery. As the game has since evolved however, player development costs for the complete minor-league system are usually recovered by the parent club after about 4 years of MLB service per MLB player. Moreover, MLB player development costs have been largely shifted from the minor leagues to the exploitation of NCAA baseball (Tier 0) over the past two decades.
Over-payment in Tier 3 is the systematic outcome of the artificial limitation of the number of players eligible for free agency. MLB teams have strong monopsony power (one buyer) over players “under their control” in T1 and T2, but after 6 seasons the monopoly power (one seller) shifts to a limited number of free-agents in Tier 3. (“Labor Market Twist”)
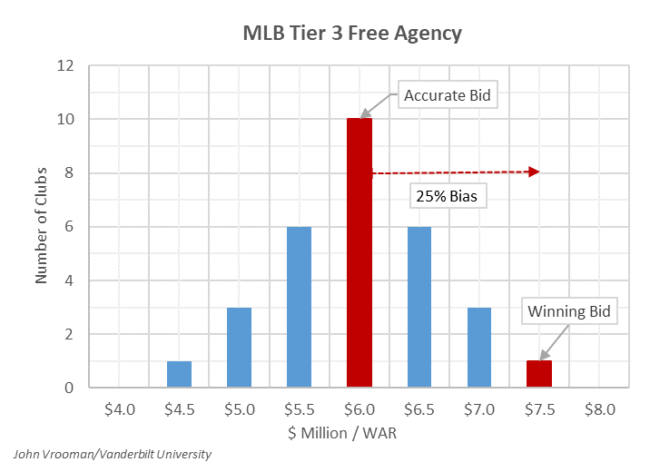
In a monopoly T3 free-agent auction, free agents are systematically overpaid about 25 percent to 33 percent, because they go to the highest bidder, rather than the most accurate bidder (“the winner’s curse”).The traditional internalization strategy is for small/mid-market clubs to develop their own underpaid (exploited) talent in Tiers 1 and 2 and avoid the expensive (overpaid) free-agent eligible talent in T3. (The Baseball Way)
Baseball’s current “tanking epidemic” began when large-market clubs co-opted the proven long-run efficient internalization strategy followed by small/mid-market clubs over the course of MLB’s natural player development talent cycle (6-8 years). (LA Dodgers and NY “Baby Bombers”)
What a Field Day for the Heat
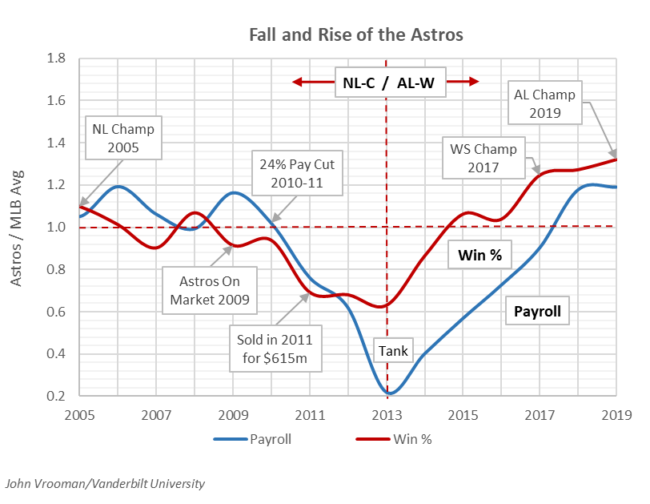
The above graph compares the normalized (for comparison on same axis) winning percentages and payroll for the Houston Astros for the 12 seasons leading up to the alleged sign stealing season of 2017 (Normalized = Astros / MLB average).
In the period immediately preceding the sale of the Astros to Jim Crane in the Spring of 2011 (for $615 million), previous owner Drayton McLane cut team payroll by 24 percent and the Astros’ winning percentage declined at about the same rate.
As new owner after 2011, Crane continued the tanking strategy with even deeper payroll cuts and T1 internalization of the Astros roster for 2012 and 2013. Crane sued McLane in 2013 over the value of regional TV network and McLane counter-sued Crane in 2019 , accusing Crane of sabotaging TV contracts by tanking in 2012-2013.
The Astros also moved from the NL Central Division to the AL West beginning in 2013 (to create 3 divisions of 5 teams in each league). Within 2 seasons after the record tanking in 2012 and 2013, the Baby Astros winning percentage increased 200 points from a franchise record low of .315 (111 losses) to .531 in 2015 and continued to rise with successive club highs in 2017 (101 wins), 2018 (103 wins) and 2019 (107 wins). The Adolescent Astros jumped from a tank-induced team-record 111 losses in 2013 to team-record high of 107 wins in 2019.
In Phase 1 of the tanking strategy, pay and performance decline together during the actual tank (see graph), because teams are dumping overpaid T3 talent. During the Phase 2 recovery period payroll rises more slowly than performance, because of the low-cost salary exploitation of T1 and T2 talent in the controlled internal market.
The vertical gap between winning and payroll (between red and blue lines) reflects profit gains from the tanking scheme derived from MLB’s monopoly power over fans on the revenue (demand) side and monopsony power over players on the cost (supply) side.
The key question remains unanswered as to whether this meteoric last-to-first rise was the result of successful money-ball, analytics-driven labor-market internalization strategy or it was instead the underhanded result of an unsophisticated trash-can banging, sign-stealing scheme by the Adolescent Astros Code-breakers in 2017.
“Decoding signs being used by an opposing catcher is not a violation of any Major League Baseball Rule or Regulation.” All teams at all levels of sporting competition steal signs or pitching tips–and this is especially true in the tradition of MLB. Forcing an opponent to reveal their strategy is the meta-game within every game.
It is clear however, that the real baseball operations of the MLB club do not “function independently of its front-office business side” as imagined by the Commissioner. The capital and labor markets of MLB are connected in theory and reality—they are unified sides of the same meta-game.
| 2012 | 2013 | 2014 | 2015 | 2016 | 2017 | 2018 | 2019 | |
| Astros Win Percentage | ||||||||
| Home | .432 | .296 | .469 | .654 | .531 | .593 | .568 | .741 |
| Away | .247 | .333 | .395 | .407 | .506 | .654 | .704 | .580 |
| Overall | .340 | .315 | .432 | .531 | .519 | .623 | .636 | .660 |
| Astros Place Out of 30 MLB Clubs | ||||||||
| Home | 28 | 30 | 24 | 5 | 16 | 5 | 11 | 1 |
| Away | 30 | 28 | 27 | 25 | 11 | 2 | 1 | 1 |
| Overall | 30 | 30 | 26 | 10 | 14 | 3 | 2 | 1 |
| Source: John Vrooman/Vanderbilt and Baseball Reference | ||||||||
There’s Something Happening Here
If the alleged electronic sign-stealing occurred only at home, then the Astros’ winning-record should have been significantly higher at home than away during 2017. On average most teams play better in their home ballpark than on the road. Over the 8-year period of Jim Crane’s ownership of the Astros (2011-2019), MLB teams have won an average of 4 to 6 games more per season at home than away.
The possible home-field measurement bias (separating a cheating effect from the better home record) is irrelevant in the Astros case, because their win percentages in 2017 and 2018 were actually higher (.654 and .704) in away games than home games (.593 and .568) by a significant margin.
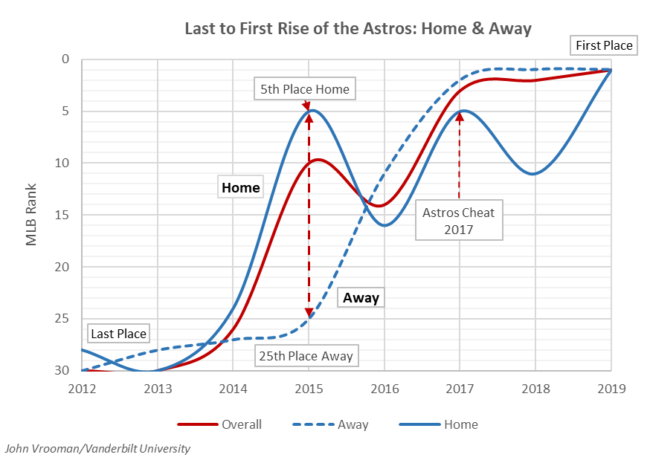
The Adolescent Astros finished 3rd overall in MLB in 2017, but they finished 2nd best on the road while placing only 5th best in MLB at the scene of the alleged Minute Maid Park sign-stealing scheme. (See the above graph.)
By 2019 the Astros actual home percentage was finally higher than their road percentage, but the 2019 Astros finished first in both home and away records–and this was well after the sign-stealing scheme had reportedly stopped in mid-2018 (according to MLB Commissioner).
In fact, the Astros consistently placed higher on the road than they did at home throughout their rise to the top 2016-2018. The glaring exception was the 2015 season, when they placed higher at home than away by a significantly large margin of 20 places. In 2015 the Astros finished 10th overall with a 5th place at home split, compared to a dismal 25th on the road. (See graph).
A difference of 20 MLB places between home and away in 2015 strongly suggests that if there was a cheating advantage, it may have gone down during the adolescent 2015 season, but not in 2017 and 2018 as alleged in the Commissioner’s report.
| Houston Astros Over/(Under) AL Hitting | |||||||
| Statistic | 2013 | 2014 | 2015 | 2016 | 2017 | 2018 | 2019 |
| Strike Outs | 25.6% | 18.6% | 14.2% | 14.1% | (17.7%) | (11.1%) | (18.3%) |
| Batting Average | (6.3%) | (4.3%) | (2.0%) | (3.9%) | 10.2% | 2.4% | 8.3% |
| On Base Percent | (6.6%) | (2.2%) | (0.9%) | (0.6%) | 6.8% | 3.5% | 9.0% |
| Slugging Percent | (7.2%) | (1.8%) | 6.1% | (1.4%) | 11.4% | 2.4% | 12.8% |
| OBP + Slugging | (7.0%) | (2.0%) | 3.0% | (1.2%) | 9.3% | 2.7% | 11.3% |
| Source: John Vrooman/Vanderbilt and Baseball Reference | |||||||
What It Is Ain’t Exactly Clear
In spite of all of the allegations, few questions have been answered about how much the sign-stealing actually affected in-game performance. Most of the casual “proof” has been the declining number of strikeouts for the Astros compared to the opposition. Presumably because the hitters knew what pitch was coming in 2017, Astros hitters struck out only 1087 times compared to the AL average of 1320 times (17.7 percent less).
The anomaly disappeared however, when the MLB low in 2017 was followed by 18.3 percent fewer strike-outs for the Astros in 2019 — a full year after the alleged cheating reportedly stopped mid-2018. (Astros 1166 K’s / AL average of 1428).
Overall the Astros’ offensive production and relative strike-out efficiency were remarkably consistent through the successful 2017-2019 run at the top, but the Adolescent Astros were allegedly dirty in 2017 and clean by 2019. The numbers suggest that it was probably one are the other for all of 2017-19.
While investigating the question that, “If The Astros Stole Signs, How Much Did It Help Them?”, 538 found that the Astros increased power while reducing strikeouts at home but they were equally efficient on the road than in the guilty season of 2017.
“Overall, at home and on the road, the Astros cut their team strikeout rate from 23.4 percent in 2016 to 17.3 percent in 2017 — going from the fourth-worst in the majors to the best.”
In addition to partial vindication of the home and away control factor, the Astros have continued to add isolated power while reducing strikeouts through the 2019 post-season–well after the alleged sign-stealing scheme was over.
“The Astros have maintained their performance gains since the end of the 2017 season. In that time, Houston has enjoyed the lowest strikeout rate in baseball and the third-best slugging mark. That efficiency helped them to the most productive lineup since the Murderer’s Row Yankees.”
A comparison of hitting stats relative to the rest of the AL since 2012 basically shows the effects of two combined money-ball analytic trends that run counter to the Strike-Out Syndrome that plagued the rest of MLB.
First, the Astros were increasing power production while reducing the inefficiency of strikeouts as the player-development internalization strategy progresses the baseball way. Second, since 2012 the Astros have made the transition from the National League style of small-ball to the American League long-ball power game.
More importantly, because of the consistency in the efficiency of the growth in offensive production from season to season in games played both home and away, there is no consistent evidence of the alleged and isolated 2017 sign-stealing scheme actually affecting the outcome of the games.
Nobody’s right if everybody’s wrong
Baseball has an unwritten ethical tradition of meta-gamesmanship and self-policing justice is often served by the players themselves. Since the long-suspected, sign-stealing epidemic was revealed after the 2019 post-season, a large wave of hypocritical criticism has been recently projected onto the Adolescent Astros’ successful seasons 2017-19.
In spite of all the condemnation there has still been no direct empirical evidence of the adverse impact on the game and the scheme that was abandoned by the players because it was distracting and ineffective. “At some point during the 2018 season, the Astros stopped using the replay review room to decode signs because the players no longer believed it was effective.”
According to the MLB Rules, “Major League Baseball Regulations do, however, prohibit the use of electronic equipment during games.” Given the over-reaction in sports media so far, the true crime seems to be that the Astros were caught crossing an arbitrary (although clearly stated) league directive and ruined the meta-game for others.
Paranoia strikes deep. The current fall-out in sports media concerns the breadth of guilt and appropriate penalty for the use of “electronic equipment” by the recently successful Astros. Unnecessarily bound by its tradition, the National Pastime has drawn an arbitrary line somewhere between tactical sign-stealing and taboo electronic sign-stealing.
Should it also be against the rules of the MLB meta-game to use technologically advanced analytics to detect hitting tendencies that now drive the current epidemic shift of defensive alignments?
Is it also against MLB rules for sportsman owners to cheat and abort their quasi-contractual obligation with season-ticket-holders by tanking and embarking on self-destructive accelerated internalization strategies? (Failure to Perform)
When the NFL faced a similar electronic communication problem/solution 25 years ago, the more technologically progressive League solved the competitive disadvantage problem by going with the evolutionary flow of technology, instead of making technological change against the law. In the NFL each offensive and defensive team is allowed one player on the field with a radio receiver in his helmet, allowing him to communicate with a coach (C2P) on the sidelines.
Technology cuts both ways. MLB should anticipate an ongoing and inevitable technological revolution and eliminate the sign-stealing problem by turning it into a solution. The solution to the sign-stealing epidemic is for MLB to incorporate electronic communication directly into the game and seek the appropriate balance between instrumental technology and ceremonial tradition.
Instead of playing a game of ceremonial whack-a-mole with ubiquitous sign-stealers, MLB should allow electronic wireless communication between/among bench coaches and the battery (pitcher + catcher) during the game. This expedient rule change would speed up (time-consuming mound visits) our beloved, but imperfect game in the process.
— V
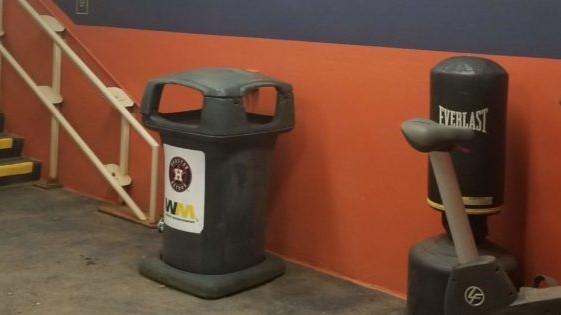
Scene of the Crime
Statistical Appendix:
Houston Astros Over/(Under) AL Hitting Averages
| Stat | 2013 | 2014 | 2015 | 2016 | 2017 | 2018 | 2019 |
| #Bats | 11% | 4% | (2%) | (7%) | (6%) | (16%) | (12%) |
| Age | (10%) | (11%) | (8%) | (8%) | 1% | 0% | 5% |
| R/G | (13%) | (7%) | 3% | (1%) | 17% | 9% | 16% |
| G | 0% | 0% | 0% | 0% | 0% | 0% | 0% |
| PA | (3%) | (1%) | (1%) | 1% | 2% | (0%) | 3% |
| AB | (2%) | (2%) | (1%) | 0% | 1% | (1%) | 1% |
| R | (13%) | (7%) | 3% | (1%) | 17% | 9% | 16% |
| H | (8%) | (6%) | (3%) | (4%) | 12% | 1% | 9% |
| 2B | (5%) | (13%) | 0% | 5% | 24% | (2%) | 12% |
| 3B | (30%) | (27%) | (16%) | 16% | (9%) | (31%) | 8% |
| HR | (11%) | 13% | 31% | 1% | 13% | 6% | 24% |
| RBI | (15%) | (7%) | 2% | (2%) | 17% | 9% | 18% |
| SB | 16% | 31% | 53% | 32% | 15% | (15%) | (12%) |
| CS | 79% | 12% | 33% | 47% | 35% | (16%) | (7%) |
| BB | (15%) | 5% | 3% | 13% | (2%) | 11% | 22% |
| SO | 26% | 19% | 14% | 14% | (18%) | (11%) | (18%) |
| BA | (6%) | (4%) | (2%) | (4%) | 10% | 2% | 8% |
| OBP | (7%) | (2%) | (1%) | (1%) | 7% | 3% | 9% |
| SLG | (7%) | (2%) | 6% | (1%) | 11% | 2% | 13%* |
| OPS | (7%) | (2%) | 3% | (1%) | 9% | 3% | 11% |
| OPS+ | (14%) | (3%) | 8% | 3% | 23% | 6% | 19% |
| TB | (9%) | (4%) | 5% | (1%) | 13% | 1% | 14% |
| GDP | (11%) | (2%) | (18%) | 5% | 6% | 32% | 27% |
| HBP | 11% | 0% | 2% | (8%) | 19% | (9%) | 6% |
| SH | 48% | (27%) | (7%) | 17% | (39%) | (18%) | (38%) |
| SF | (16%) | (20%) | (2%) | (23%) | 49% | 7% | 43% |
| IBB | (43%) | (13%) | (19%) | 35% | 13% | (14%) | (6%) |
| LOB | (10%) | (2%) | (4%) | 0% | 1% | (3%) | 7% |
| Source: John Vrooman/Vanderbilt University and Baseball Reference | |||||||
| MLB Houston Franchise History | ||||||
| Season | W | L | PCT | GB | Place | Attendance |
| 2019 | 107 | 55 | .660 | – | 1 | 2,857,367 |
| 2018 | 103 | 59 | .636 | – | 1 | 2,980,549 |
| 2017 | 101 | 61 | .623 | – | 1 | 2,403,671 |
| 2016 | 84 | 78 | .519 | 11 | 3 | 2,306,623 |
| 2015 | 86 | 76 | .531 | 2 | 2 | 2,153,585 |
| 2014 | 70 | 92 | .432 | 28 | 4 | 1,751,829 |
| 2013 | 51 | 111 | .315 | 45 | 5 | 1,651,911 |
| 2012 | 55 | 107 | .340 | 42 | 6 | 1,607,733 |
| 2011 | 56 | 106 | .346 | 40 | 6 | 2,067,016 |
| 2010 | 76 | 86 | .469 | 15 | 4 | 2,331,490 |
| 2009 | 74 | 88 | .457 | 17 | 5 | 2,521,076 |
| 2008 | 86 | 75 | .534 | 11 | 3 | 2,779,287 |
| 2007 | 73 | 89 | .451 | 12 | 4 | 3,020,405 |
| 2006 | 82 | 80 | .506 | 1.5 | 2 | 3,022,763 |
| 2005 | 89 | 73 | .549 | 11 | 2 | 2,804,760 |
| 2004 | 92 | 70 | .568 | 13 | 2 | 3,087,872 |
| 2003 | 87 | 75 | .537 | 1 | 2 | 2,455,241 |
| 2002 | 84 | 78 | .519 | 13 | 2 | 2,517,267 |
| 2001 | 93 | 69 | .574 | – | 1 | 2,904,277 |
| 2000 | 72 | 90 | .444 | 23 | 4 | 3,056,139 |
| 1999 | 97 | 65 | .599 | – | 1 | 2,707,017 |
| 1998 | 102 | 60 | .630 | – | 1 | 2,450,451 |
| 1997 | 84 | 78 | .519 | – | 1 | 2,046,275 |
| 1996 | 82 | 80 | .506 | 6 | 2 | 1,977,715 |
| 1995 | 76 | 68 | .528 | 9 | 2 | 1,392,683 |
| 1994 | 66 | 49 | .574 | 0.5 | 2 | 1,560,970 |
| 1993 | 85 | 77 | .525 | 19 | 3 | 2,081,506 |
| 1992 | 81 | 81 | .500 | 17 | 4 | 1,211,348 |
| 1991 | 65 | 97 | .401 | 29 | 6 | 1,196,152 |
| 1990 | 75 | 87 | .463 | 16 | 4 | 1,313,560 |
| 1989 | 86 | 76 | .531 | 6 | 3 | 1,863,215 |
| 1988 | 82 | 80 | .506 | 12.5 | 5 | 1,933,635 |
| 1987 | 76 | 86 | .469 | 14 | 3 | 1,920,997 |
| 1986 | 96 | 66 | .593 | – | 1 | 1,734,266 |
| 1985 | 83 | 79 | .512 | 12 | 3 | 1,184,383 |
| 1984 | 80 | 82 | .494 | 12 | 2 | 1,230,579 |
| 1983 | 85 | 77 | .525 | 6 | 3 | 1,352,942 |
| 1982 | 77 | 85 | .475 | 12 | 5 | 1,560,396 |
| 1981 | 61 | 49 | .555 | 6 | 3 | 1,321,222 |
| 1980 | 93 | 70 | .571 | – | 1 | 2,308,092 |
| 1979 | 89 | 73 | .549 | 1.5 | 2 | 1,915,449 |
| 1978 | 74 | 88 | .457 | 21 | 5 | 1,128,233 |
| 1977 | 81 | 81 | .500 | 17 | 3 | 1,099,580 |
| 1976 | 80 | 82 | .494 | 22 | 3 | 886,622 |
| 1975 | 64 | 97 | .398 | 43.5 | 6 | 858,285 |
| 1974 | 81 | 81 | .500 | 21 | 4 | 1,093,105 |
| 1973 | 82 | 80 | .506 | 17 | 4 | 1,393,998 |
| 1972 | 84 | 69 | .549 | 10.5 | 2 | 1,464,244 |
| 1971 | 79 | 83 | .488 | 11 | 4 | 1,245,235 |
| 1970 | 79 | 83 | .488 | 23 | 4 | 1,247,444 |
| 1969 | 81 | 81 | .500 | 12 | 5 | 1,442,995 |
| 1968 | 72 | 90 | .444 | 25 | 10 | 1,326,718 |
| 1967 | 69 | 93 | .426 | 32.5 | 9 | 1,354,177 |
| 1966 | 72 | 90 | .444 | 23 | 8 | 1,878,398 |
| 1965 | 65 | 97 | .401 | 32 | 9 | 2,151,470 |
| 1964 | 66 | 96 | .407 | 27 | 9 | 726,155 |
| 1963 | 66 | 96 | .407 | 33 | 9 | 719,502 |
| 1962 | 64 | 96 | .400 | 36.5 | 8 | 927,106 |
©2024 Vanderbilt University · John Vrooman
Site Development: University Web Communications