SITE NAVIGATION
Pre-Design
Literature Review
Early in the project, we were tasked with a literature review. During the first round of review, we found information on numerous methods of footbridge designs and design in foreign countries. We then performed a second round of review to cover gaps in knowledge. This round was focused more on learning about the conditions in Honduras such as the local geology, hydrology, and available materials. This information was used in the following assessments and further informed decisions throughout the project.
Hydrological Assessment
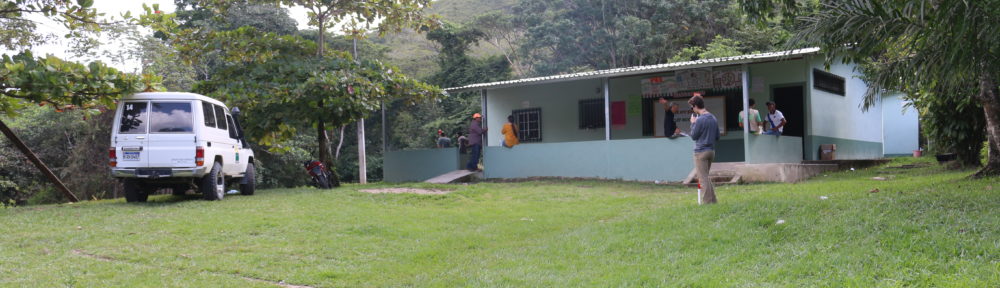
In order to determine the bridge span and minimum height, our team needed to determine the high water mark of the stream near the clinic. During the site visit, we interviewed nearby community members to determine what they remembered as the highest water level. We used a topographic map of the area to delineate the surrounding watershed.The site location is marked on the west side of the watershed with a large “X.”Next, our team used a hydrologic modeling software called HEC-HMS to determine the maximum flow rate at the bridge site.
-
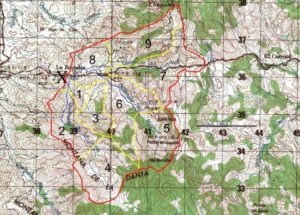
- Topographic Map

-

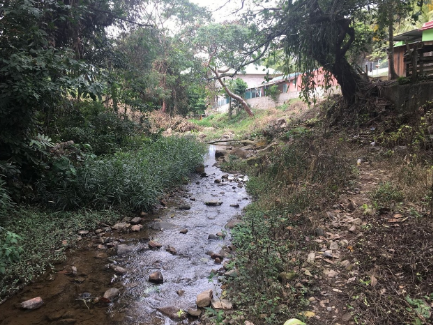
- Riverbed
-
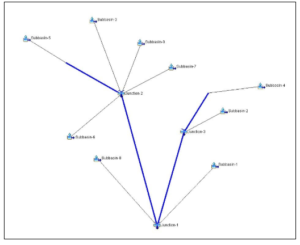
- HEC-HMS Model
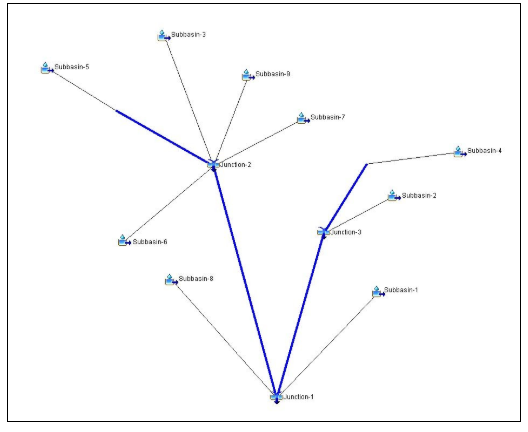
Precipitation data from Hurricane Mitch was used in the model. The conceptual map of our model is shown on above. Finally, the maximum flow rate was used to determine the water height based on the shape of the stream bed. Our team used the information from the community to check our modeled results. We chose to use the water height given to us by the community members.
Geological Assessment
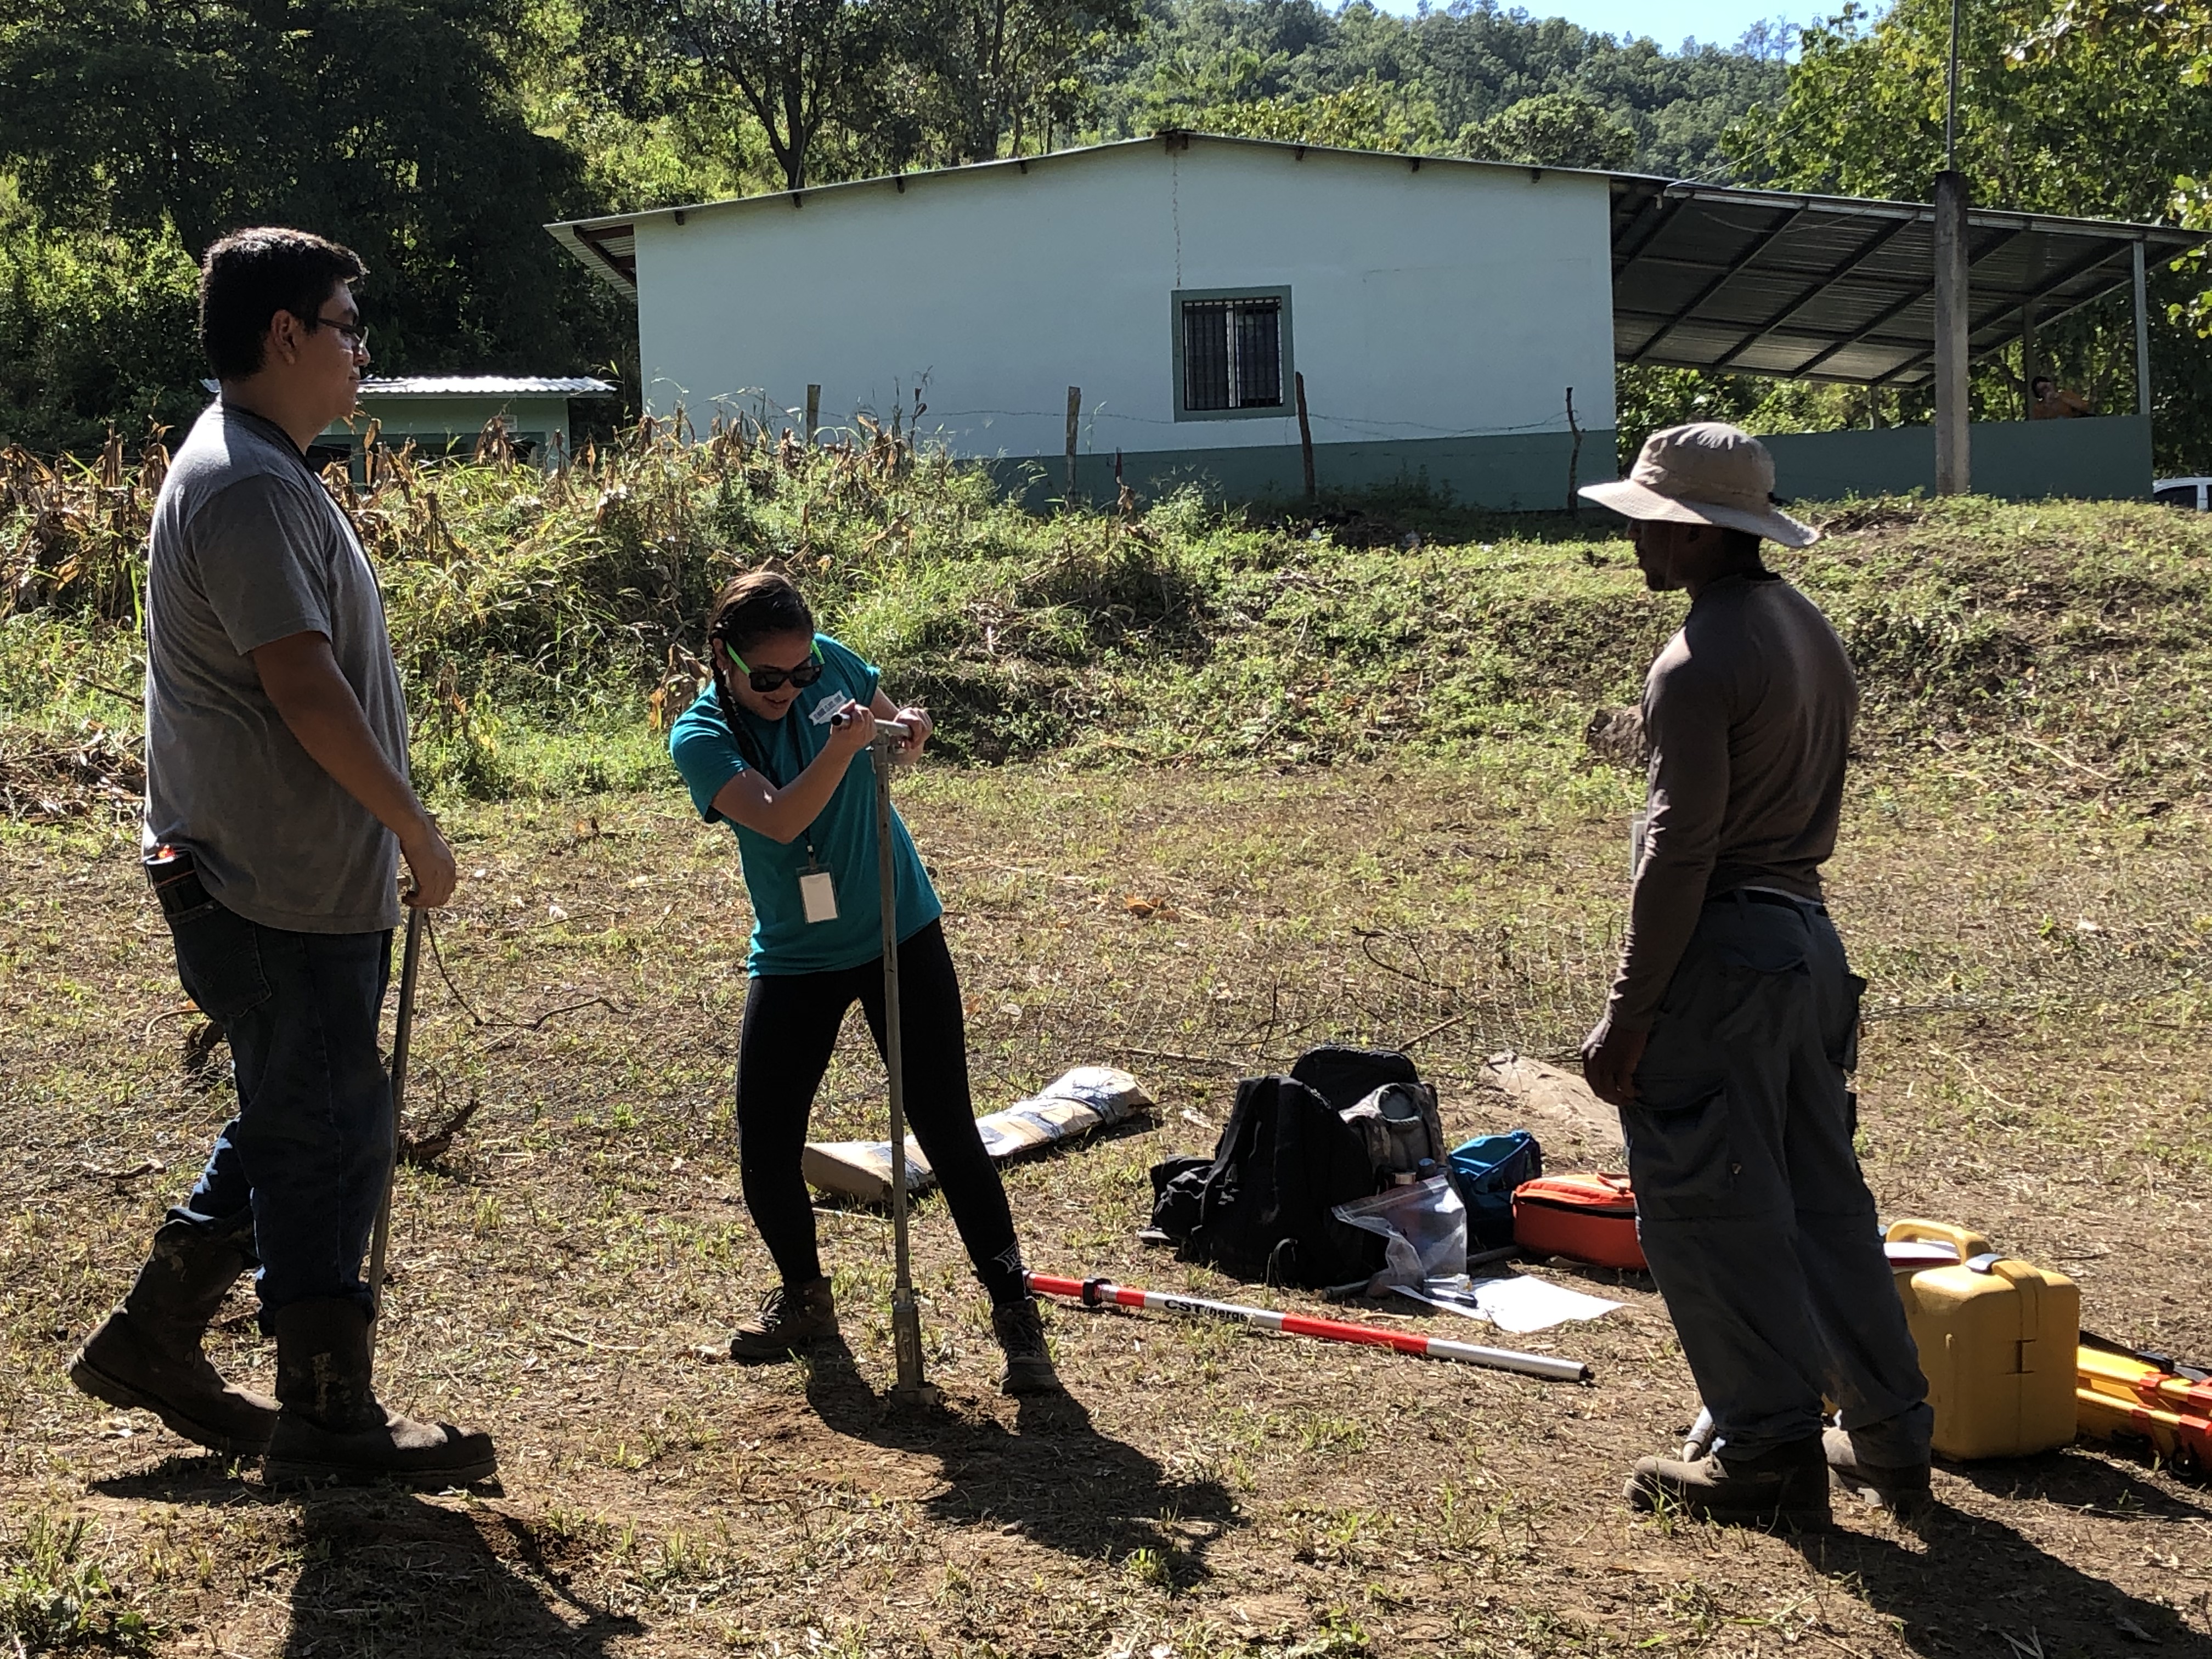
During the site visit, we performed geotechnical tests to gather soil samples and determine ground conditions. We conducted both auger testing to gather soil samples and a dynamic cone penetration test at each boring hole. We collected four boring samples, 3 on the clinic side and 1 on the street side. Only two of the samples made it through customs. The assessment write-up and lab testing was conducted by the Lipscomb design team. In the lab, a sieve analysis and atterberg limits testing were conducted. The soil was classified as poorly graded sand. This data was compiled and used in our foundation design.