Ema Topolnjak, Chenyu Gao, Lori L Beason-Held, Susan M Resnick, Kurt G Schilling, Bennett A Landman. “Assessment of subject head motion in diffusion MRI”. Medical Imaging 2024: Image Processing 12926, 327-334, https://doi.org/10.1117/12.3006633
Abstract
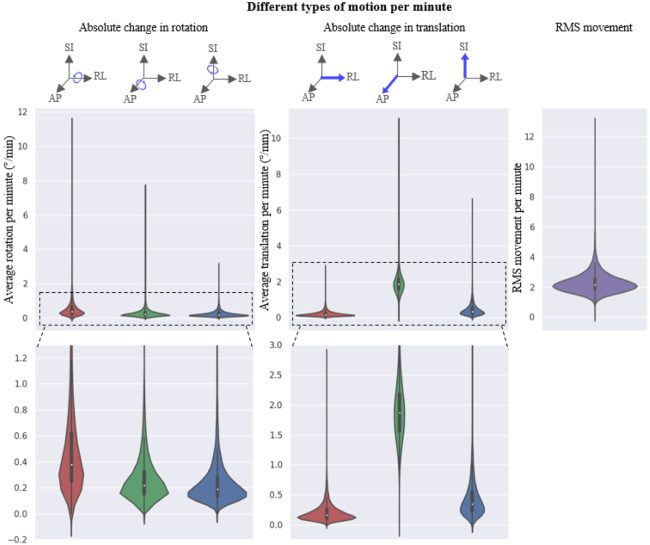
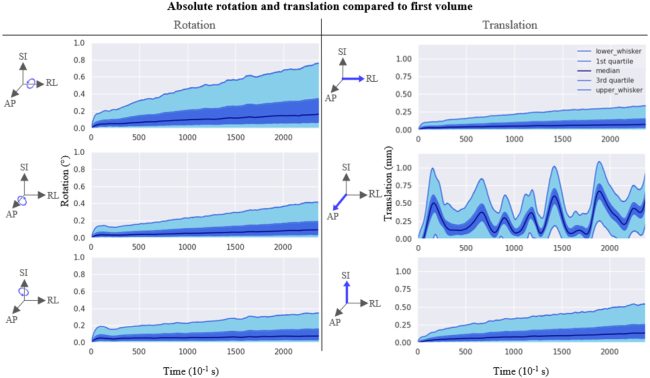
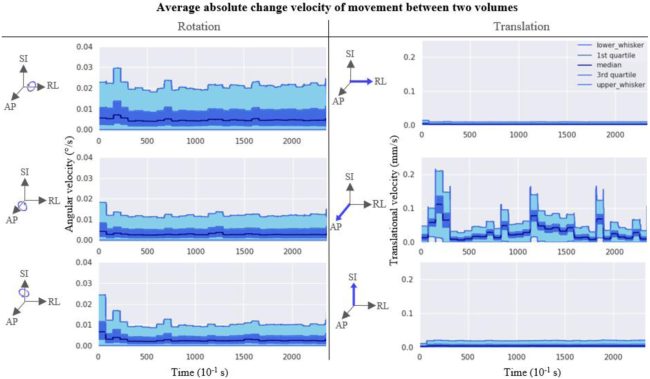
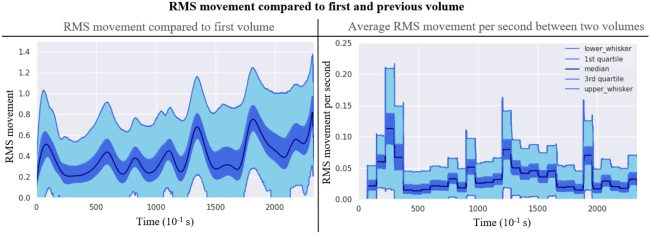
Subject head motion during the acquisition of diffusion-weighted imaging (DWI) of the brain induces artifacts and affects image quality. Information about the frequency and extent of motion could reveal which aspects of motion correction are most necessary. Therefore, we investigate the extent of translation and rotation among participants, and how the motion changes during the scan acquisition. We analyze 5,380 DWI scans from 1,034 participants. We measure the rotations and translations in the sagittal, coronal and transverse planes needed to align the volumes to the first and previous volumes, as well as the displacement. The different types of motion are compared with each other and compared over time. The largest rotation (per minute) is around the right – left axis (median 0.378 °/min, range 0.000 – 11.466°) and the largest translation (per minute) is along the anterior – posterior axis (median 1.867 mm/min, range 0.000 – 10.944 mm). We additionally observe that spikes in movement occur at the beginning of the scan, particularly in anterior – posterior translation. The results show that all scans are affected by subtle head motion, which may impact subsequent image analysis.
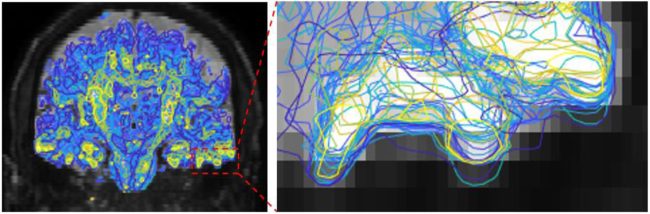
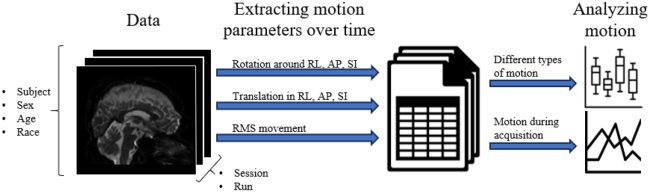
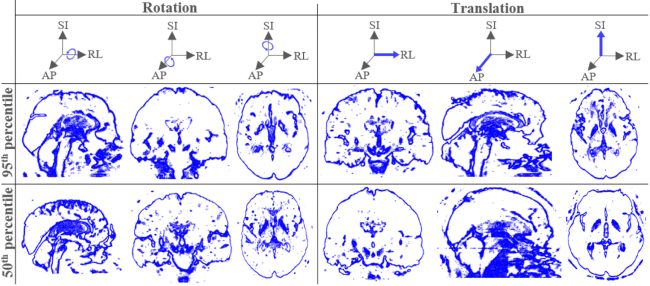
Figure 1: Example of a subject who moved during scanning. Each line shows the contour of the brain of one volume (left). The differences between all the contours show subject movement during the scan (right).Figure 2: For each study, information about the subject and the image acquisition is collected. The measures to align the scans (rotation and translation) and RMS movement over all voxels are calculated. Thereafter, different types of motion and motion over time are analyzed.Figure 3: Examples of scans with a lot (95th percentile) and median (50th percentile) motion. Every line shows the contour of one volume. The lines at the 95th percentile are thicker than at the 50th percentile showing more motion.Figure 4: RL = right – left (blue), AP = anterior – posterior (orange), SI = superior – inferior (green). Rotation around RL occurs the most, rotation around AP and SI occur similar. The most translation is along RL, then SI, and then RL.Figure 5: Absolute rotation (left) and translation (right) around / along the RL (top), AP (middle) and SI (bottom) axes compared to the first volume. The dark blue colored area shows the range between the 25th and 75th percentile. The light blue colored area shows the range between the lower whisker and 25th percentile and between the 75th percentile and upper whisker.Figure 6: Average absolute angular velocity (left) and translational velocity (right) around / along the RL (top), AP (middle) and SI (bottom) axes between two consecutively acquired volumes. The dark blue colored area shows the range between the 25th and 75th percentile. The light blue colored area shows the range between the lower whisker and 25th percentile and between the 75th percentile and upper whisker.Figure 7: RMS movement compared to the first volume (left) and average RMS movement per second between two consecutively acquired volumes (right). The dark blue colored area shows the range between the 25th and 75th percentile. The light blue colored area shows the range between the lower whisker and 25th percentile and between the 75th percentile and upper whisker.