Neuroimaging Outside the Brain (Ophthalmological and Spinal)
Motivation
Disorders of the optic nerve (ON) account for a significant percentage of the 20 most impactful ophthalmological conditions. Collectively, diseases of the ON are the number one cause of irreversible blindness worldwide. These diseases include multiple sclerosis related optic neuritis, ischemic optic neuropathy, traumatic optic neuropathy, nutritional optic neuropathy, toxic optic neuropathy, dysthyroid optic neuropathy, compressive optic neuropathy and glaucoma. Glaucoma, long thought to be primarily a problem related to intraocular pressure, is now widely considered “an optic neuropathy in which the optic nerve axons are damaged, resulting in death of retinal ganglion cells.” Glaucoma is the second leading cause of blindness worldwide, impacts more than three million Americans, and costs the U.S. economy almost $3 billion per year. Optic neuritis (i.e., inflammatory demyelination of the ON) is the initial symptom in ~25% of all multiple sclerosis (MS) cases (which impacts over 400 thousand Americans and introduces societal health care costs of nearly $30 billion per year). Nearly two thirds of MS patients will experience episodes of optic neuritis in their lifetimes, and 40-60% of patients have visual defects localized to the ON. We are working to translate medical imaging computing procedures from the neuroimaging community to provide robust, quantitative tools for assessing the optic nerve (ON) on clinical and research imaging sequences. We believe these efforts will improve prognostic accuracy, lead to better understanding of patient responses, and enhance targeted interventions.
Research objectives
- Create image processing methods to address resolution, distortion, and field of view difficulties inherent with optic nerve imaging.
- Develop quantitative analysis techniques to improve multi-modal imaging (MRI, CT, diffusion MRI, MT, CEST, etc.) of the optic nerve.
- Identify structural and quantitative biomarkers to improve prognostic assessments, aid in navigation, and better understand etiology of optic nerve disease.
Progress
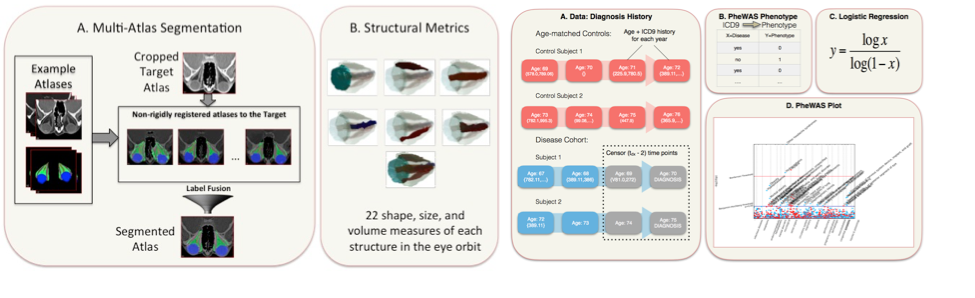
The overall goal of this research is build a foundation for image analysis of the ON and its relationships with pathological disorders. We created the first multi-atlas methods for segmenting the orbit and have achieved leading performance on CT, T1w-MRI, and T2w-MRI. With Dr. Seth Smith (Radiology), we created new high-resolution, high-contrast MRI sequences that can map both the optic nerve and its surrounding sheath and are applying these to a study of multiple sclerosis. To complement these sequences, we created the first image analysis methods to map optic nerve and sheath morphometry from the sheath to the chiasm and showed that patients with clinically measured pathology have localized structural pathology of their optic nerve. We are charactering a larger population of healthy patients to create a statistical atlas or healthy anatomy and understand normal variability of structural morphometry. We have constructed the Vanderbilt Pathologies of the Human Eye, Orbit, and The Optic Nerve (PHOTON) database of more than 1500 patients and 2500 controls that characterize eye health, interventional histories, vision disability, and quantifies structural phenotypes through clinical imaging. We are applying this system to study structural correlates of optic nerve disease, better under the etiology of orbital conditions, and develop prognostic markers for optic nerve health. We customized the EMR-based phenome-wide association study (PheWAS) to derive diagnostic EMR phenotypes that occur at least two years prior to the onset of the conditions of interest from a cohort of 28,411 ophthalmology patients. We used random forest classifiers to evaluate the predictive power of image-derived markers, EMR phenotypes, and clinical visual assessments in identifying disease cohorts from a control group of 1,566 patients without optic nerve disease. Image-derived markers showed more predictive power than clinical visual assessments or EMR phenotypes (Figure 5). We are continuing to push forward on these studies using large cohorts of clinically acquired data with the intent of uncovering correlations between image-derived metrics and patient outcomes while reaching out to the Ophthalmology resident research projects to increase the use of imaging in eye studies at Vanderbilt.