Chenyu Gao, Qi Yang, Michael E Kim, Nazirah Mohd Khairi, Leon Y Cai, Nancy R Newlin, Praitayini Kanakaraj, Lucas W Remedios, Aravind R Krishnan, Xin Yu, Tianyuan Yao, Panpan Zhang, Kurt G Schilling, Daniel Moyer, Derek B Archer, Susan M Resnick, Bennett A Landman, for the Alzheimer’s Disease Neuroimaging Initiative, the BIOCARD Study team. “Characterizing patterns of diffusion tensor imaging variance in aging brains”. Journal of Medical Imaging 11 (4), 044007-044007. https://doi.org/10.1117/1.JMI.11.4.044007
Abstract
Purpose
As large analyses merge data across sites, a deeper understanding of variance in statistical assessment across the sources of data becomes critical for valid analyses. Diffusion tensor imaging (DTI) exhibits spatially varying and correlated noise, so care must be taken with distributional assumptions. Here, we characterize the role of physiology, subject compliance, and the interaction of the subject with the scanner in the understanding of DTI variability, as modeled in the spatial variance of derived metrics in homogeneous regions.
Approach
We analyze DTI data from 1035 subjects in the Baltimore Longitudinal Study of Aging, with ages ranging from 22.4 to 103 years old. For each subject, up to 12 longitudinal sessions were conducted. We assess the variance of DTI scalars within regions of interest (ROIs) defined by four segmentation methods and investigate the relationships between the variance and covariates, including baseline age, time from the baseline (referred to as “interval”), motion, sex, and whether it is the first scan or the second scan in the session.
Results
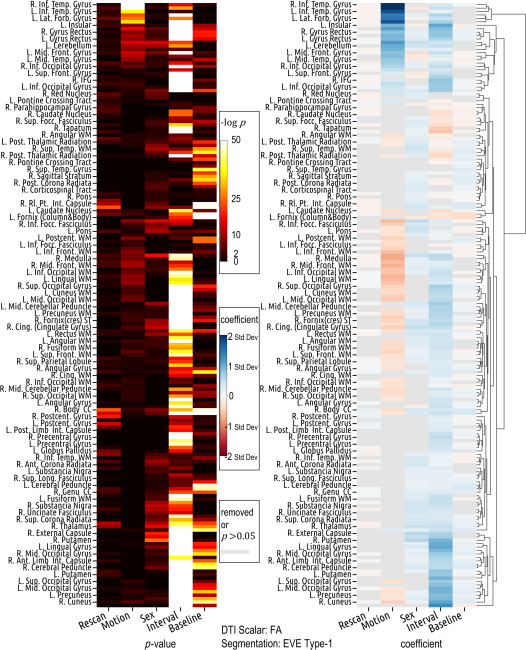
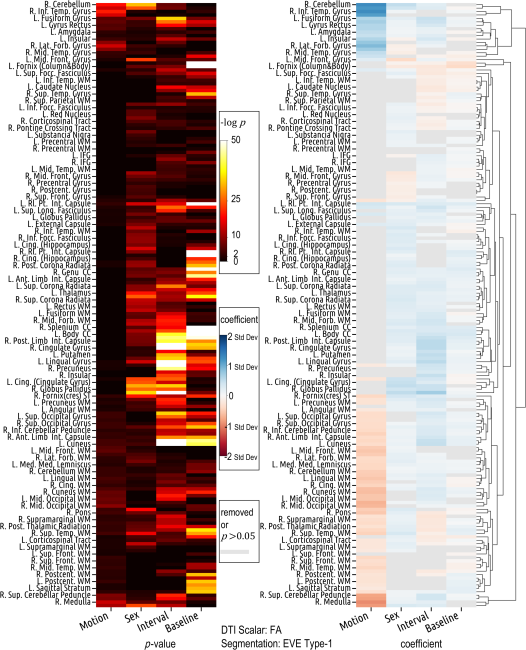
Covariate effects are heterogeneous and bilaterally symmetric across ROIs. Inter-session interval is positively related ( p ≪ 0.001 ) to FA variance in the cuneus and occipital gyrus, but negatively ( p ≪ 0.001 ) in the caudate nucleus. Males show significantly ( p ≪ 0.001 ) higher FA variance in the right putamen, thalamus, body of the corpus callosum, and cingulate gyrus. In 62 out of 176 ROIs defined by the Eve type-1 atlas, an increase in motion is associated ( p < 0.05 ) with a decrease in FA variance. Head motion increases during the rescan of DTI ( Δ μ = 0.045 mm per volume).
Conclusions
The effects of each covariate on DTI variance and their relationships across ROIs are complex. Ultimately, we encourage researchers to include estimates of variance when sharing data and consider models of heteroscedasticity in analysis. This work provides a foundation for study planning to account for regional variations in metric variance.
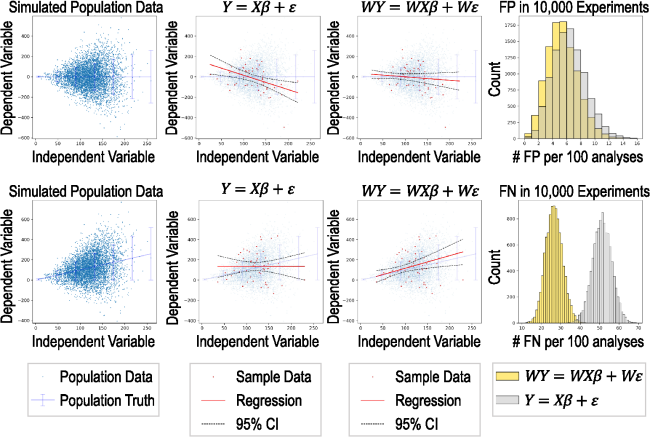
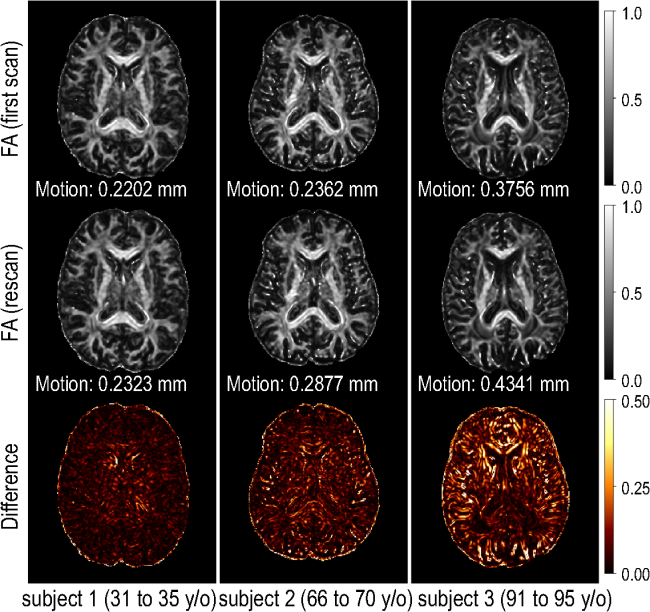
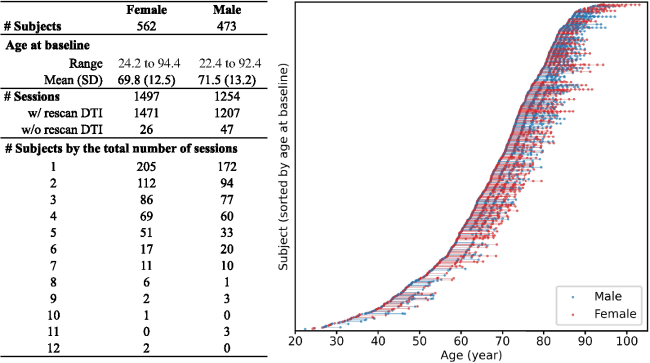
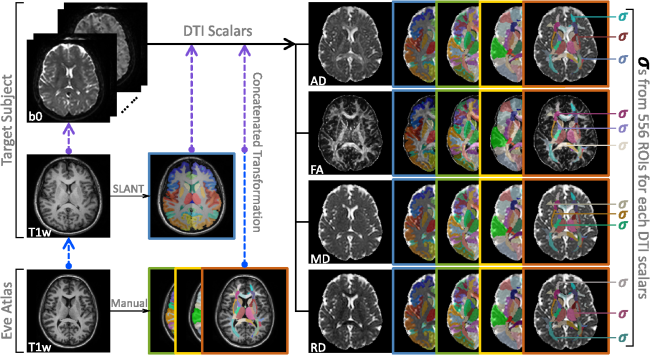
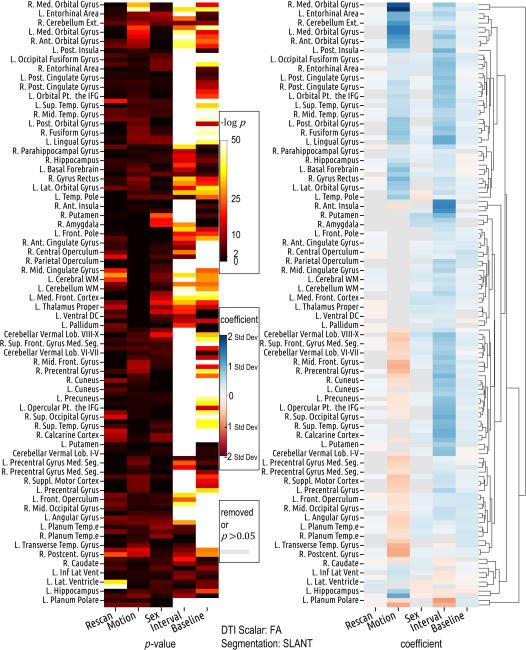
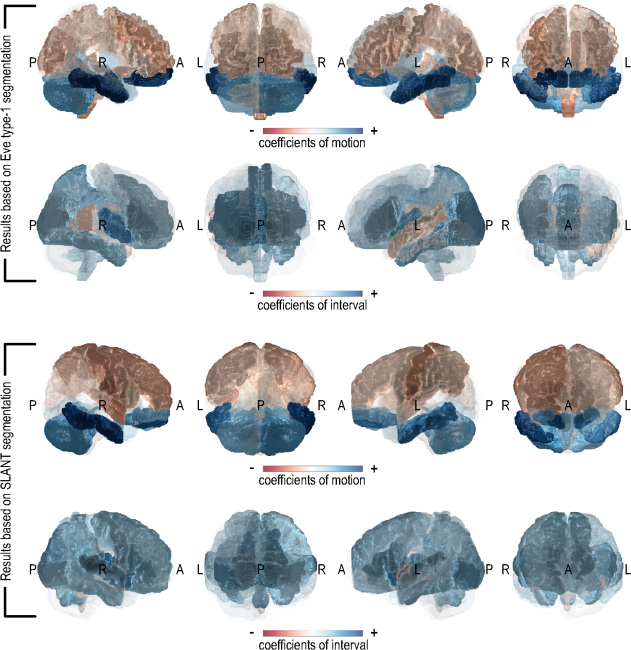
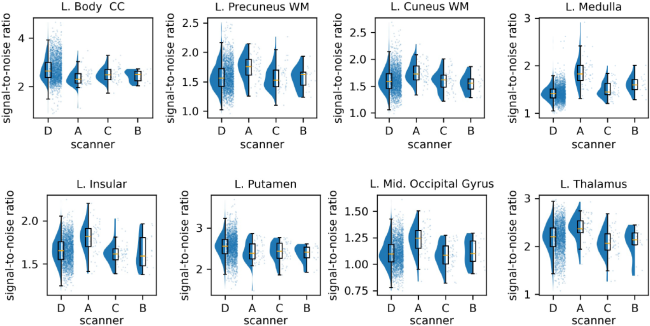
Fig. 1 Simulation shows that applying the whitening matrix to the standard linear regression equation reduces the number of false positives (FP) and false negatives (FN) under heteroskedasticity. In the top row, the population truth has zero slope. In data sampled from the synthetic population data, ordinary least square (OLS) regression using the standard equation generates FP, while the solution with whitening, W, does not falsely reject the null hypothesis (the horizontal line). After 10,000 experiments, the FP frequency is lower with whitening, centering at 5 per 100. In the second row, the population truth has a positive slope. In data sampled from the synthetic population data, OLS regression using the standard equation generates FN, while the solution with whitening, W, does not. After 10,000 experiments, the FN frequency with whitening is half that of the one without whitening.Fig. 2 We observe that the noise (approximated by the difference between the scan and rescan acquired within the same imaging session) in DTI scalar images, such as FA images, generally increases with age. (Subjects’ ages are grouped into 5-year bins to respect privacy.) But motion is also considered to increase with age. We would like to know the following: Which factor is associated with DTI variance? Where and how does this association manifest?Fig. 3 The BLSA dataset we use has a slight imbalance between the number of females and males, but it is well-matched and appropriate for our research objectives in other aspects: (i) the age ranges of females and males align closely; (ii) rescan DTI data were acquired in most sessions, enabling inter-scan comparisons; and (iii) the distributions of sessions of females and males align closely.Fig. 4 Brain segmentation labels are obtained using the SLANT segmentation of the target subject’s T1w image and using three types of manual parcellations provided by the Eve atlas. To generate transformation matrices for transferring these labels to DTI scalar images, intra- and inter-modality registrations are performed. Standard deviations of DTI scalars within each ROI are computed.Fig. 5 Covariate effects on FA standard deviation (standardized) are region-specific. Motion and interval exhibit opposite effect directions in many ROIs. Gender differences exist in multiple ROIs. Counterintuitively, motion is negatively related to FA standard deviation in many ROIs. The lookup table for the abbreviation of the ROI name is in the Supplementary Material 2.Fig. 6 The region-specific and bidirectional patterns of covariate effects are similarly observed in the results derived from SLANT segmentation, despite its differing definitions and delineations of ROIs compared to Eve type-1 segmentation (Fig. 5).Fig. 7 Despite the different definitions and delineations of ROIs between Eve type-1 and SLANT segmentations, results based on the two segmentation methods are largely similar (comparable regions are colored similarly) and both show that the effects of motion and interval on FA variance vary across ROIs.Fig. 8 SNR of the FA images across eight Eve type-1 atlas-defined ROIs, including white matter (WM) regions (body of the corpus callosum, precuneus WM, cuneus WM), gray matter regions (insular, putamen, middle occipital gyrus, thalamus), and mixed regions (medulla), in four different scanners of BLSA (where scanner A is the 1.5 Tesla Philips Intera scanner and scanners B/C/D are the 3 Tesla Philips Achieva scanners). “L.” stands for the left hemisphere of the brain.Fig. 9 To assess the generalizability of our findings, we include two additional datasets, ADNI and BIOCARD, and fit the linear mixed-effects models. The coefficients and p-values show similar patterns to those from BLSA alone, despite that the effect sizes and the hierarchical clustering are different, partly due to the omission of the rescan covariate.