Chenyu Gao, Shunxing Bao, Michael E Kim, Nancy R Newlin, Praitayini Kanakaraj, Tianyuan Yao, Gaurav Rudravaram, Yuankai Huo, Daniel Moyer, Kurt Schilling, Walter A Kukull, Arthur W Toga, Derek B Archer, Timothy J Hohman, Bennett A Landman, Zhiyuan Li. “Field-of-view extension for brain diffusion MRI via deep generative models”. Journal of Medical Imaging 11 (4), 044008-044008. https://doi.org/10.1117/1.JMI.11.4.044008
Abstract
Purpose
In brain diffusion magnetic resonance imaging (dMRI), the volumetric and bundle analyses of whole-brain tissue microstructure and connectivity can be severely impeded by an incomplete field of view (FOV). We aim to develop a method for imputing the missing slices directly from existing dMRI scans with an incomplete FOV. We hypothesize that the imputed image with a complete FOV can improve whole-brain tractography for corrupted data with an incomplete FOV. Therefore, our approach provides a desirable alternative to discarding the valuable brain dMRI data, enabling subsequent tractography analyses that would otherwise be challenging or unattainable with corrupted data.
Approach
We propose a framework based on a deep generative model that estimates the absent brain regions in dMRI scans with an incomplete FOV. The model is capable of learning both the diffusion characteristics in diffusion-weighted images (DWIs) and the anatomical features evident in the corresponding structural images for efficiently imputing missing slices of DWIs in the incomplete part of the FOV.
Results
For evaluating the imputed slices, on the Wisconsin Registry for Alzheimer’s Prevention (WRAP) dataset, the proposed framework achieved PSNRb0=22.397, SSIMb0=0.905, PSNRb1300=22.479, and SSIMb1300=0.893; on the National Alzheimer’s Coordinating Center (NACC) dataset, it achieved PSNRb0=21.304, SSIMb0=0.892, PSNRb1300=21.599, and SSIMb1300=0.877. The proposed framework improved the tractography accuracy, as demonstrated by an increased average Dice score for 72 tracts (p<0.001) on both the WRAP and NACC datasets.
Conclusions
Results suggest that the proposed framework achieved sufficient imputation performance in brain dMRI data with an incomplete FOV for improving whole-brain tractography, thereby repairing the corrupted data. Our approach achieved more accurate whole-brain tractography results with an extended and complete FOV and reduced the uncertainty when analyzing bundles associated with Alzheimer’s disease.
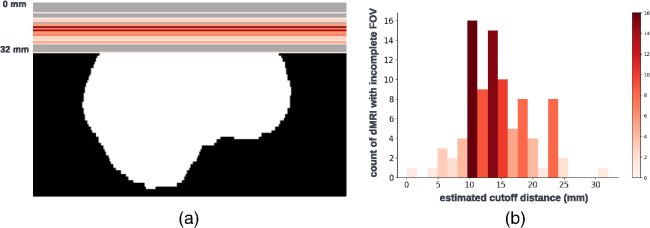
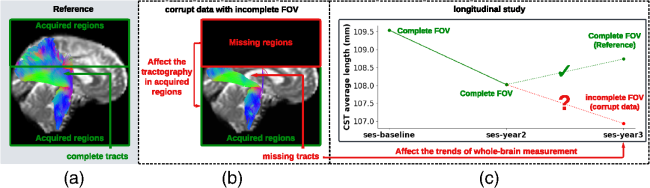
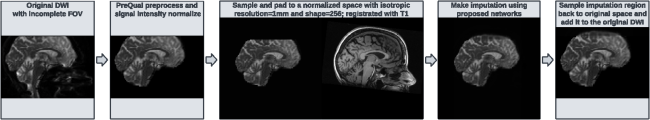
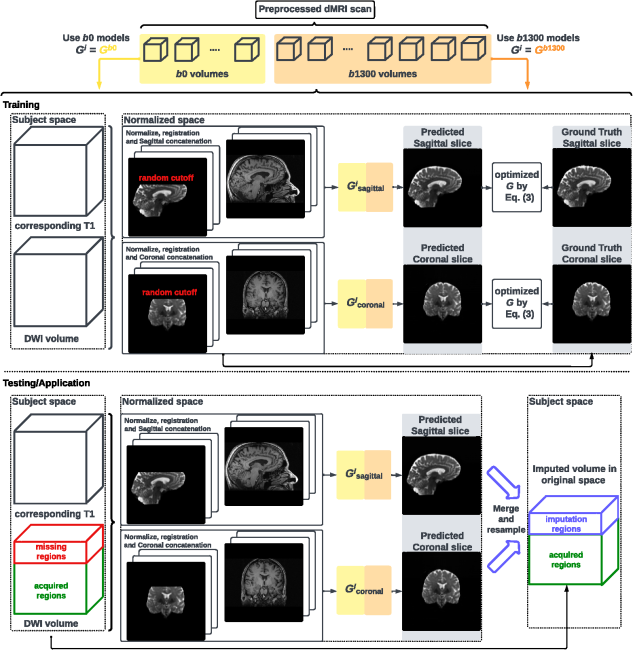
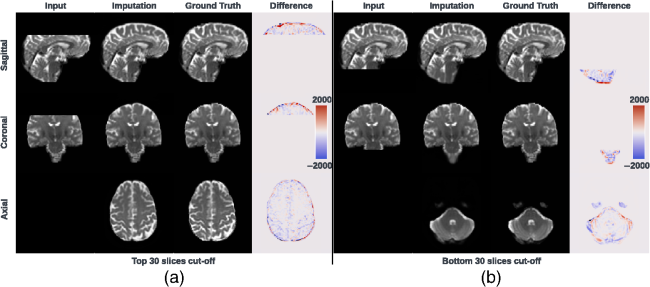
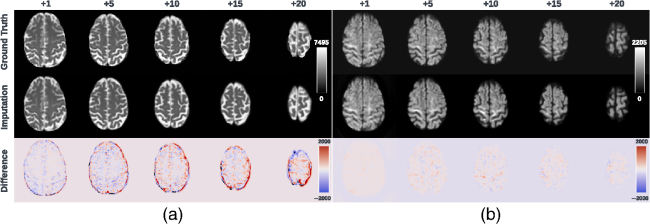
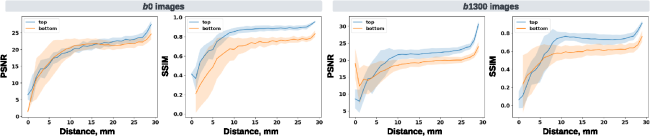
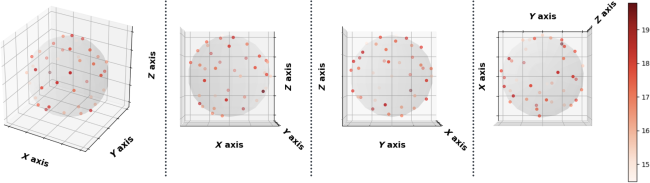
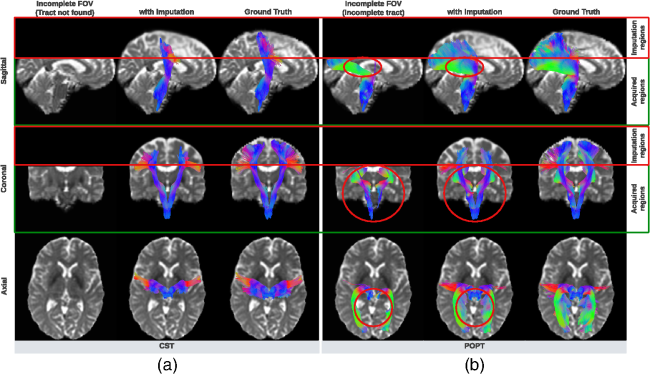
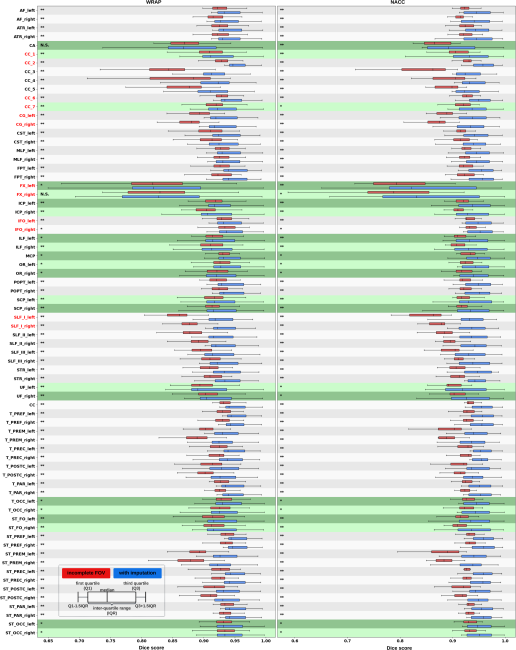
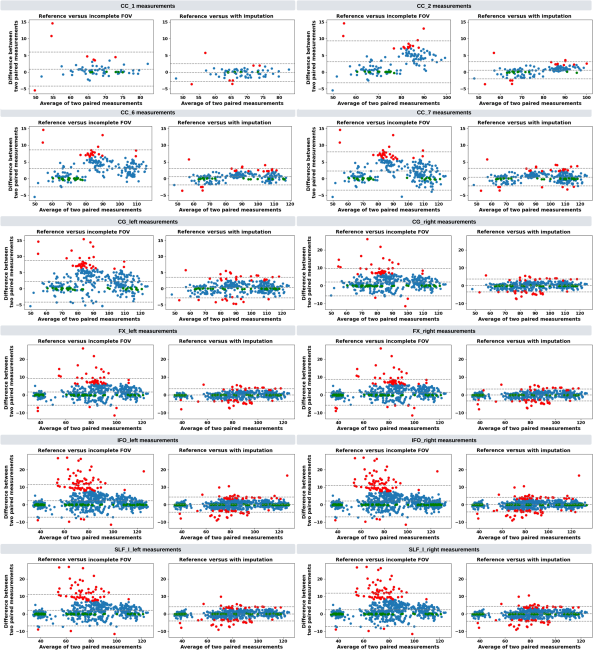
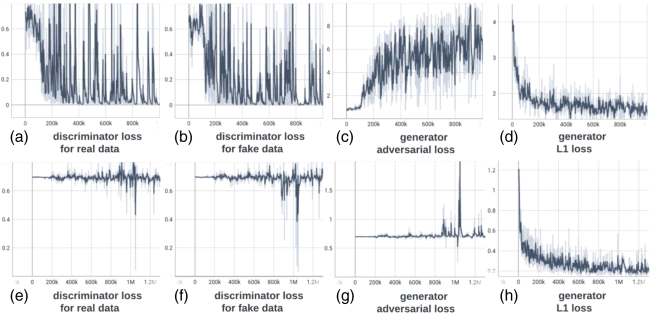
Fig. 1 Visualization (a) and histogram (b) of 103 real cases of dMRI scans with an incomplete FOV that failed quality assurance. In panel (a), horizontal red lines and background gray areas indicate where the reduced FOV ends and its corresponding missing regions, respectively, with the estimated position of a brain mask. The total cutoff distance from the reduced FOV to the top of the brain is estimated using a corresponding and registered T1w image.Fig. 2 Missing regions resulting from an incomplete FOV not only render analyses of those areas impossible but can also impact the tractography performed in the acquired regions [as shown in panel (b)], e.g., yielding missing streamlines of corticospinal tract (CST) compared with the reference [as shown in panel (a)]. Furthermore, whole-brain measurements derived from corrupted data can lead to incorrect interpretations in longitudinal studies [as shown in panel (c)]: the measurement from corrupted data (represented by the red dot for the “year3” session) might suggest that the average length of the CST for this subject continues to decrease. This, however, may contradict when correct measurements are considered (represented by green dots).Fig. 3 Pipeline of the proposed FOV extension framework for imputing missing slices in the incomplete part of the FOV begins with PreQual preprocessing and intensity normalization for the DWI in its original space. This is followed by processing the DWI to a normalized space, including resampling and registration with its corresponding T1 image. Subsequently, the proposed 2.5D pix2pix networks are employed to impute the missing slices in the normalized space, utilizing both the DWI (incomplete FOV) and the corresponding T1 (complete FOV). Finally, the imputed regions are resampled back to their original space and added to the original DWI. Sagittal views of a b0 volume with an incomplete FOV at each pipeline stage are visualized.Fig. 4 Whole DWI imputation task is divided into four sub-tasks: imputing b0 volumes’ sagittal slices, imputing b0 volumes’ coronal slices, imputing b1300 volumes’ sagittal slices, and imputing b1300 volumes’ coronal slices. The proposed 2.5D networks contain four sub-networks that share the same pix2pix network architecture, and each subnetwork is designed to process a specific sub-task for b0 or b1300 images with their sagittal or coronal slices. During training, random regions are cut off from either top or bottom of brain to obtain training DWI data with an incomplete FOV, and the subnetworks are optimized to make the imputation of the cutoff regions using Eq. (3). In the testing or application case, for each DWI volume with an incomplete FOV, its corresponding sagittal and coronal subnetworks each output an imputed volume by combining every imputed sagittal or coronal slice, respectively. These two imputed volumes are then merged into one volume to improve 3D consistency. The imputation regions of the final merged volume are sampled back to the original subject space and are added to the original DWI volume.Fig. 5 Imputation for both the top (a) and bottom (a) of the brain. Red and blue indicate that the imputed intensity is larger or smaller than the ground truth, respectively. The imputation achieved similar global contrast and anatomical patterns compared with the ground truth reference. A closer examination of local areas, as indicated by the difference image, reveals large imputation errors at the boundaries between the white matter and the gray matter and at the edges of the brain. In addition, the proposed framework tends to make blurry imputation, thereby losing the high-frequency information that details the brain structure.Fig. 6 Axial slice imputations for b0 images (a) and b1300 images (b). The color lookup tables are adjusted with different intensity ranges for a better display of diffusion-weighted volumes. Each column represents the distance to the nearest acquired slice in millimeters (mm). Red and blue indicate that the imputed intensity is larger or smaller than the ground truth reference, respectively. Consistent with Fig. 5, the proposed framework performs imputations that globally align with the ground truth reference, albeit with a blurrier appearance. In addition, increasing imputation errors are observed as the distance of the imputed slices increases, for both b0 and b1300 images.Fig. 7 Imputation performance with respect to the distance from the top or bottom of the brain, assuming a complete brain. The larger the distance is, the closer it is to the acquired region. Both PSNR and SSIM metrics for b0 and b1300 images show an ascending trend, indicating an improving imputation accuracy when approaching the nearest acquired region, and a higher error margin in slices adjacent to the top or bottom of the brain. At a 30 mm distance, which is approximately the closest missing slice to the acquired brain region, the imputation accuracy markedly improves, as evidenced by the rising tail of each plotted line.Fig. 8 Imputation performance (PSNR) with respect to 40 directions of diffusion-encoding gradient pulse evaluated by ADC. The average PSNR of ADC is 16.991±1.221. No obvious visual bias is observed in any direction. p-Value>0.05 for the Kruskal–Wallis test (p=0.999), which fails to reject the null hypothesis that the medians of each direction’s measurements are the same.Fig. 9 Tractography results of example tracts for images with an incomplete FOV alongside their imputed counterparts and the ground truth references. The tracts produced through imputed images closely resemble the ground truth reference tracts within the acquired regions but lack some streamlines near the brain’s edge in the imputed regions. Our approach notably enhances the accuracy and completeness of tracts that are significantly compromised with an incomplete FOV. As shown in panel (a), corticospinal tract (CST) is completely not detected for images with an incomplete FOV, but with imputation, CST is produced successfully. In panel (b), the image with an incomplete FOV yields a partial Parieto-occipital pontine (POPT) only, yet the imputed image rectifies and completes the tract’s overall shape and structure within the acquired regions.Fig. 10 In both the WRAP and NACC datasets, the proposed framework enhances tractography accuracy through FOV extension (with imputation), as evidenced by the overall higher Dice scores compared with those with an incomplete FOV. Tracts commonly associated with AD have their names in red. Tracts that are not cutoff by an incomplete FOV have green shading in their boxplots. Paired t-tests were conducted for each tract, and the statistical significance is denoted by “*” (p<0.05), “**” (p<0.01), and “N.S.” (not significant).Fig. 11 Bland–Altman plots of the agreement for bundle average length compared with reference. The best 10% measurements with the smallest errors are denoted in green, and the worst 10% measurements with the largest errors are denoted in red. Tracts commonly associated with Alzheimer’s disease (AD) that can be impacted by an incomplete FOV (up to 30 mm from the top of the brain), specifically CC_1, CC_2, CC_6, CC_7, CG, FX, IFO, and SLF_I, are examined. Our approach effectively reduces the significant variations in measurements caused by incomplete FOVs. In the “Reference versus with Imputation” figures, the measurement distribution is tightly clustered and oriented toward the middle dashed line, indicating coherent and consistent agreement with the reference. By contrast, the “Reference versus Incomplete FOV” figures show that the measurements span a large range on the y-axis, suggesting substantial errors and variations. By providing consistent measurements of bundles associated with AD, our method can reduce the uncertainty in AD studies that may contain corrupted data due to an incomplete FOV.Fig. 12 Training graphs for b0 model (a)–(d) and b1300 model (e)–(h). During training, the losses of the discriminator and generator balance each other, demonstrating stable training for their min–max game. The L1 loss of the generator shows a clear decreasing trend and eventually converges.