Notice: Undefined index: reset in /var/www/my.vanderbilt.edu/html/wp-content/mu-plugins/cets_blog_defaults.php on line 1404
Tomography | Medical-image Analysis and Statistical Interpretation (MASI) Lab | Vanderbilt University Skip to main content

‘Tomography’


Notice: Undefined offset: 0 in /var/www/my.vanderbilt.edu/html/wp-includes/media.php on line 642

Notice: Undefined offset: 0 in /var/www/my.vanderbilt.edu/html/wp-includes/media.php on line 649

Notice: Undefined offset: 1 in /var/www/my.vanderbilt.edu/html/wp-includes/media.php on line 649

Notice: Undefined offset: 0 in /var/www/my.vanderbilt.edu/html/wp-includes/media.php on line 642

Notice: Undefined offset: 0 in /var/www/my.vanderbilt.edu/html/wp-includes/media.php on line 649

Notice: Undefined offset: 1 in /var/www/my.vanderbilt.edu/html/wp-includes/media.php on line 649

Notice: Undefined offset: 0 in /var/www/my.vanderbilt.edu/html/wp-includes/media.php on line 642

Notice: Undefined offset: 0 in /var/www/my.vanderbilt.edu/html/wp-includes/media.php on line 649

Notice: Undefined offset: 1 in /var/www/my.vanderbilt.edu/html/wp-includes/media.php on line 649

Notice: Undefined offset: 0 in /var/www/my.vanderbilt.edu/html/wp-includes/media.php on line 642

Notice: Undefined offset: 0 in /var/www/my.vanderbilt.edu/html/wp-includes/media.php on line 649

Notice: Undefined offset: 1 in /var/www/my.vanderbilt.edu/html/wp-includes/media.php on line 649

Notice: Undefined offset: 0 in /var/www/my.vanderbilt.edu/html/wp-includes/media.php on line 48

Notice: Undefined offset: 1 in /var/www/my.vanderbilt.edu/html/wp-includes/media.php on line 49

Notice: Undefined offset: 0 in /var/www/my.vanderbilt.edu/html/wp-includes/media.php on line 48

Notice: Undefined offset: 1 in /var/www/my.vanderbilt.edu/html/wp-includes/media.php on line 49
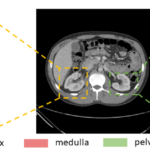
Figure 1. Renal structures segmentation of clinically acquired CT image. Yellow box shows a representative right kidney, green box shows the left kidney. The zoom-in patches show the CT kidney field-of-view (FOV) and labels. The label patches display the renal cortex (blue), the medulla (red) and the pelvicalyceal system (green). Those small structures make automatic renal segmentation challenging.

Renal Cortex, Medulla and Pelvicaliceal System Segmentation on Arterial Phase CT Images with Random Patch-based Networks

Nov. 21, 2020—Yucheng Tang, Riqiang Gao, Ho Hin Lee, Brent V. Savoie, Shunxing Bao, Yuankai Huo, Jeffrey Spraggins and Bennett A, Landman, Renal Cortex, Medulla, Pelvis Segmentation on Arterial Phase CT Images with Random Patch-based Networks, SPIE 2021 Medical Imaging Full Text Abstract Renal segmentation on contrast-enhanced computed tomography (CT) provides distinct spatial context and morphology. Current studies for renal segmentations...
Read more


Notice: Undefined variable: showcats in /var/www/my.vanderbilt.edu/html/wp-content/themes/ANCHORDOWN-Vanderbilt-my/library/partials/post-list-format.php on line 21