Simultaneous total intracranial volume and posterior fossa volume estimation using multi‐atlas label fusion
Yuankai Huo, Andrew J. Asman, Andrew J. Plassard, Bennett A. Landman. “Simultaneous total intracranial volume and posterior fossa volume estimation using multi‐atlas label fusion.” Human Brain Mapping. In Press October 2016
Full text: https://www.ncbi.nlm.nih.gov/pubmed/27726243
Abstract
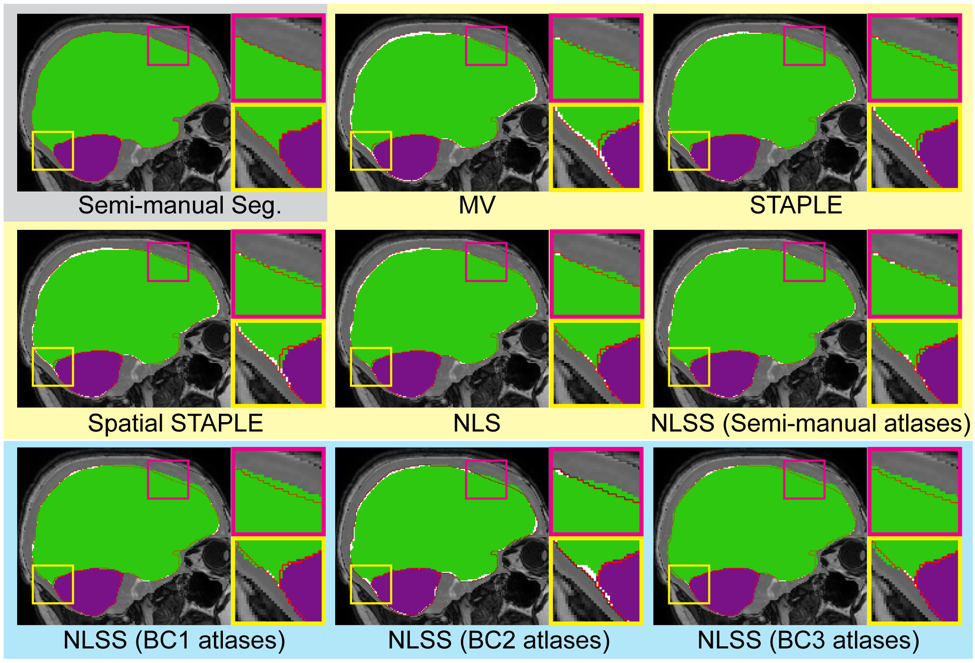
Total intracranial volume (TICV) is an essential covariate in brain volumetric analyses. The prevalent brain imaging software packages provide automatic TICV estimates. FreeSurfer and FSL estimate TICV using a scaling factor while SPM12 accumulates probabilities of brain tissues. None of the three provide explicit skull/CSF boundary (SCB) since it is challenging to distinguish these dark structures in a T1-weighted image. However, explicit SCB not only leads to a natural way of obtaining TICV (i.e., counting voxels inside the skull) but also allows sub-definition of TICV, for example, the posterior fossa volume (PFV). In this article, they proposed to use multi-atlas label fusion to obtain TICV and PFV simultaneously. The main contributions are: (1) TICV and PFV are simultaneously obtained with explicit SCB from a single T1-weighted image. (2) TICV and PFV labels are added to the widely used BrainCOLOR atlases. (3) Detailed mathematical derivation of non-local spatial STAPLE (NLSS) label fusion is presented. As the skull is clearly distinguished in CT images, we use a semi-manual procedure to obtain atlases with TICV and PFV labels using 20 subjects who both have a MR and CT scan. The proposed method provides simultaneous TICV and PFV estimation while achieving more accurate TICV estimation compared with FreeSurfer, FSL, SPM12, and the previously proposed STAPLE based approach. The newly developed TICV and PFV labels for the OASIS BrainCOLOR atlases provide acceptable performance, which enables simultaneous TICV and PFV estimation during whole brain segmentation. The NLSS method and the new atlases have been made freely available. Hum Brain Mapp, 2016. © 2016 Wiley Periodicals, Inc.