Structural-Functional Relationships Between Eye Orbital Imaging Biomarkers and Clinical Visual Assessments
Xiuya Yao, Shikha Chaganti, Kunal P. Nabar, Katrina Nelson, Andrew Plassard, Rob L. Harrigan, Louise A. Mawn, Bennett A. Landman. “Structural-Functional Relationships Between Eye Orbital Imaging Biomarkers and Clinical Visual Assessments” In Proceedings of the SPIE Medical Imaging Conference. Orlando, Florida, February 2017. Oral presentation.
Full Text:
Abstract
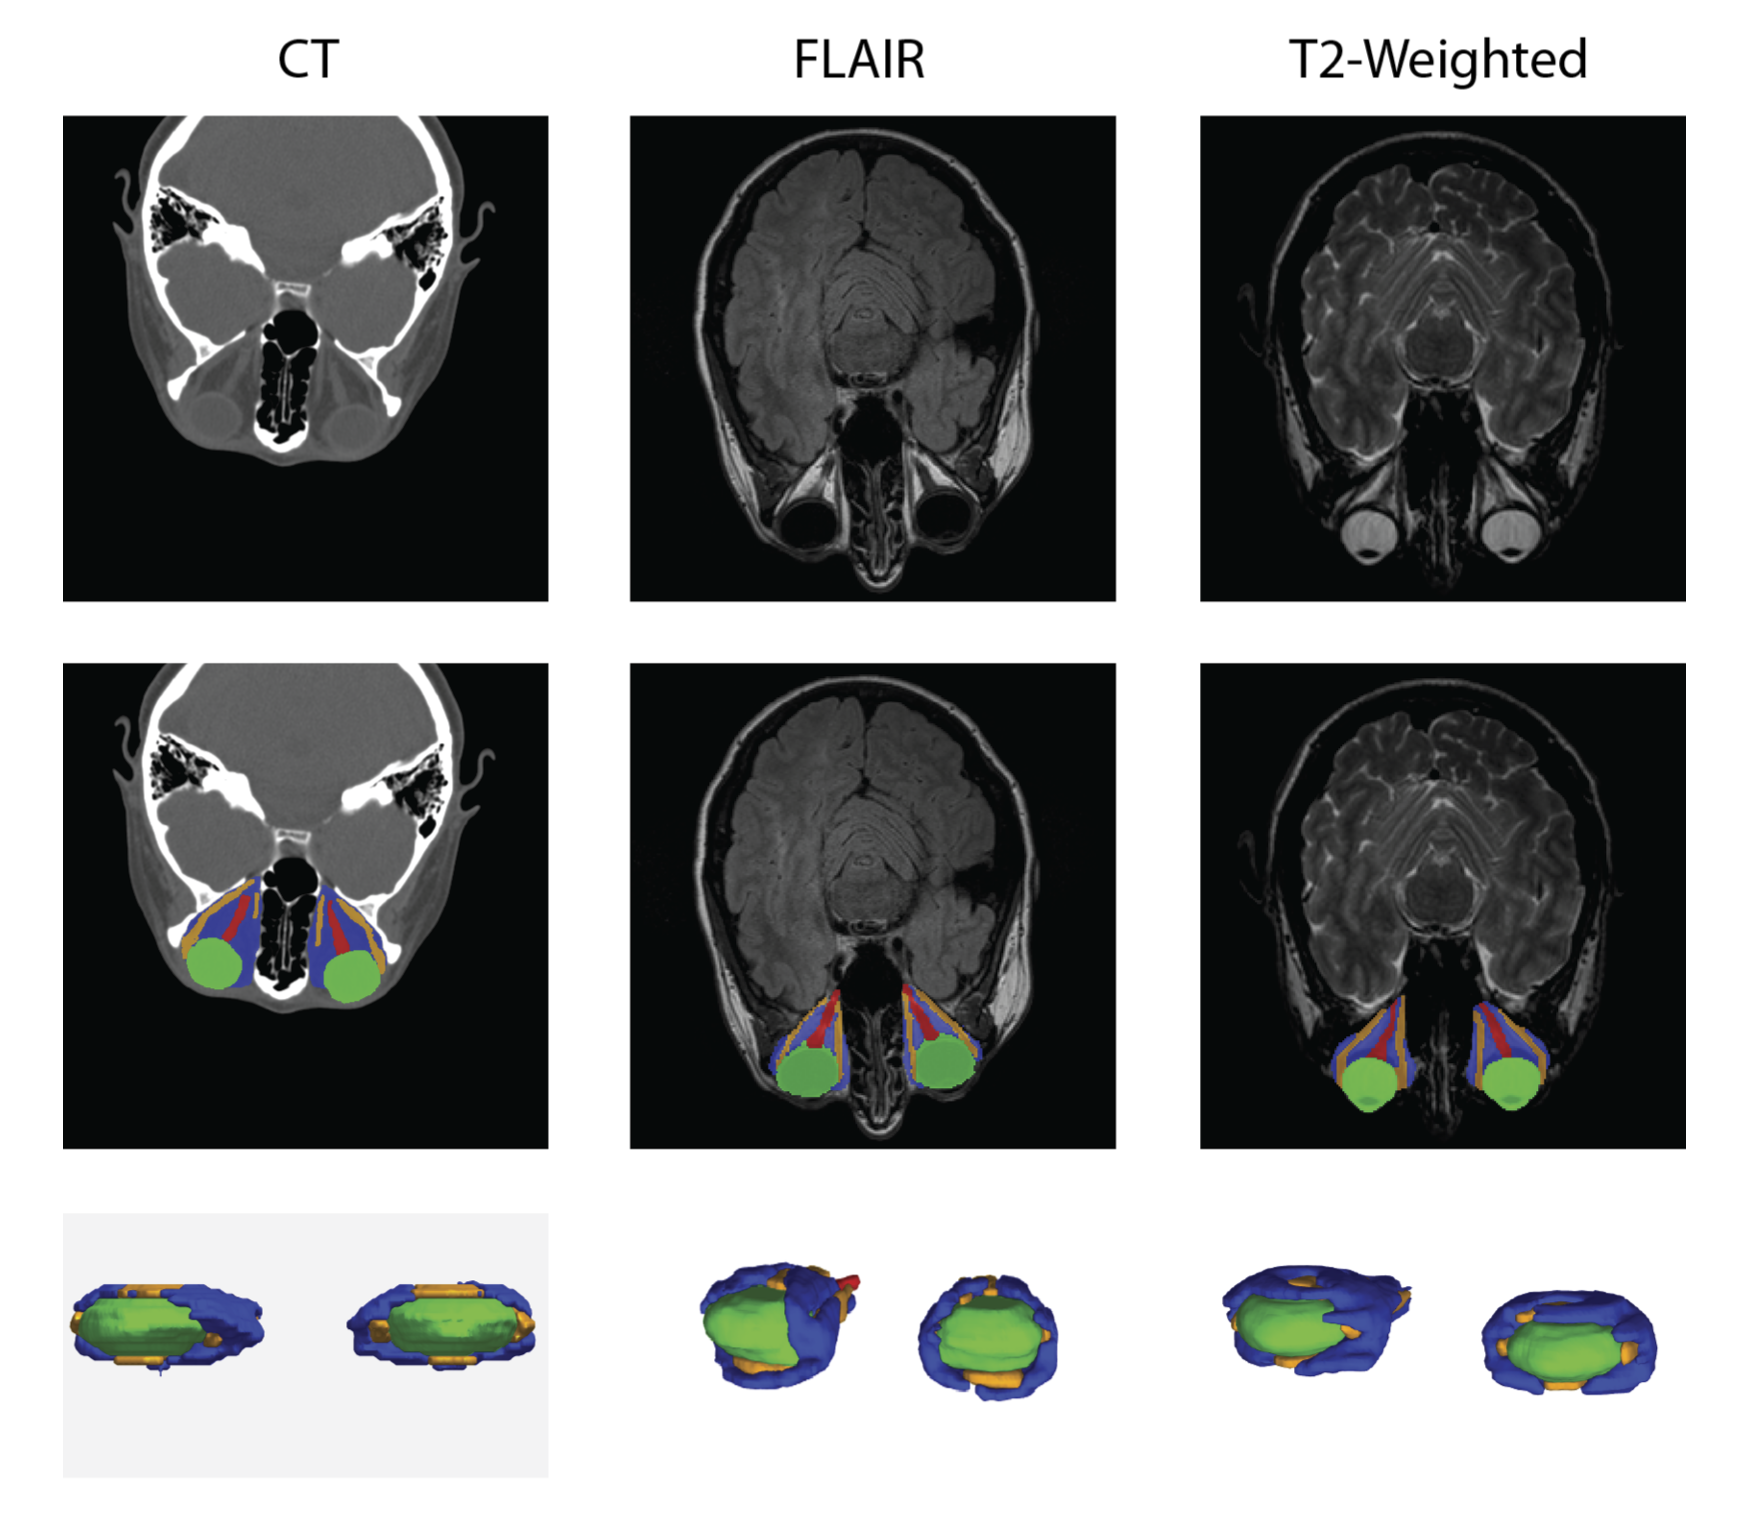
Eye diseases and visual impairment affect millions of Americans and induce billions of dollars in annual economic burdens. Expounding upon existing knowledge of eye diseases could lead to improved treatment and disease prevention. This research investigated the relationship between structural metrics of the eye orbit and visual function measurements in a cohort of 470 patients from a retrospective study of ophthalmology records for patients (with thyroid eye disease, orbital inflammation, optic nerve edema, glaucoma, intrinsic optic nerve disease), clinical imaging, and visual function assessments. Orbital magnetic resonance imaging (MRI) and computed tomography (CT) images were retrieved and labeled in 3D using multi-atlas label fusion. Based on the 3D structures, both traditional radiology measures (e.g., Barrett index, volumetric crowding index, optic nerve length) and novel volumetric metrics were computed. Using stepwise regression, the associations between structural metrics and visual field scores (visual acuity, functional acuity, visual field, functional field, and functional vision) were assessed. Across all models, the explained variance was reasonable (R2 ~ 0.1-0.2) but highly significant (p < 0.001). Instead of analyzing a specific pathology, this study aimed to analyze data across a variety of pathologies. This approach yielded a general model for the connection between orbital structural imaging biomarkers and visual function.