Empirical consideration of the effects of acquisition parameters and analysis model on clinically feasible q-ball imaging
Kurt G. Schilling, Vishwesh Nath, Justin Blaber Prasanna Parvathaneni, Adam W. Anderson, Bennett A. Landman. “Empirical consideration of the effects of acquisition parameters and analysis model on clinically feasible q-ball imaging” Magnetic Resonance Imaging. Submitted November 2016. (In Press).
Full Text: https://www.ncbi.nlm.nih.gov/pubmed/28438712
Abstract
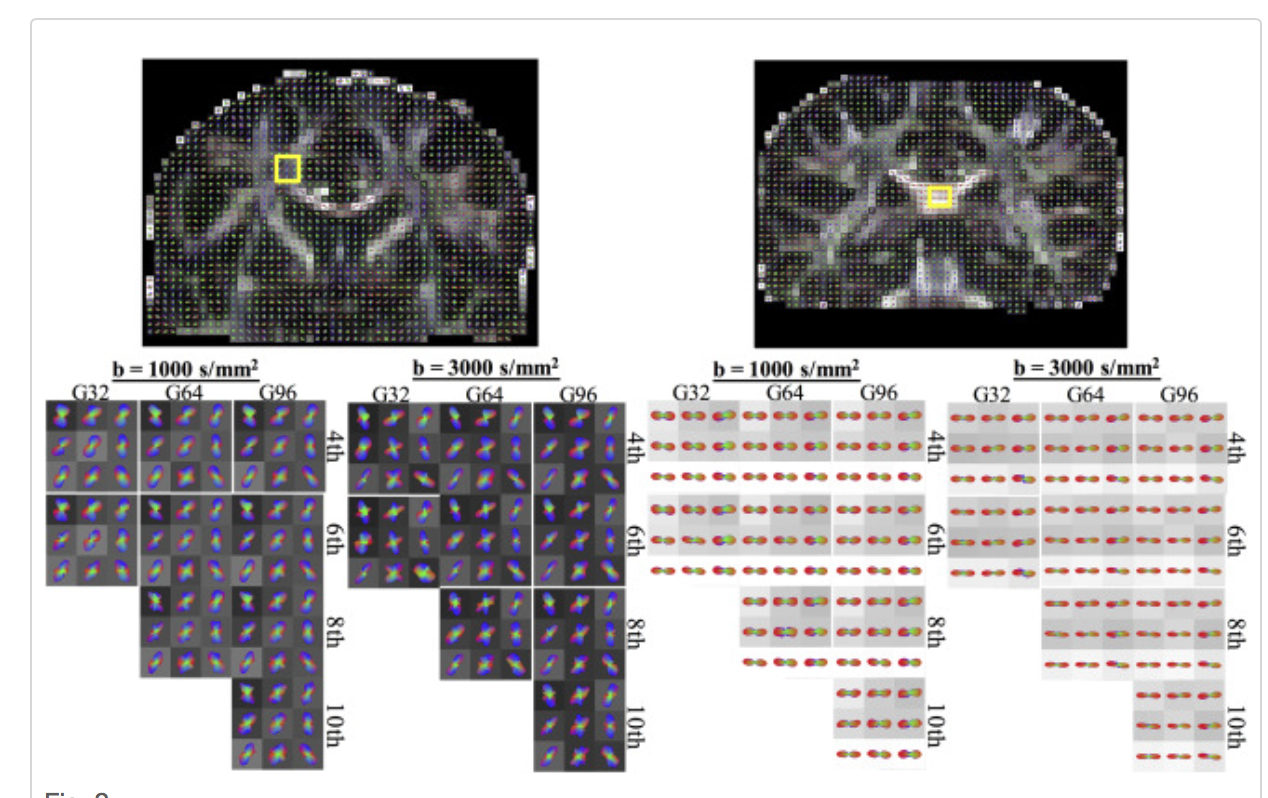
Q-ball imaging (QBI) is a popular high angular resolution diffusion imaging (HARDI) technique used to study brain architecture in vivo. Simulation and phantom-based studies suggest that QBI results are affected by the b-value, the number of diffusion weighting directions, and the signal-to-noise ratio (SNR). However, optimal acquisition schemes for QBI in clinical settings are largely undetermined given empirical (observed) imaging considerations. In this study, we acquire a HARDI dataset at five b-values with 11 repetitions on a single subject to investigate the effects of acquisition scheme and subsequent analysis models on the accuracy and precision of measures of tissue composition and fiber orientation derived from clinically feasible QBI at 3T. Clinical feasibility entails short scan protocols – less than 5minutes in the current study – resulting in lower SNR, lower b-values, and fewer diffusion directions than are typical in most QBI protocols with research applications, where time constraints are less prevalent. In agreement with previous studies, we find that the b-value and number of diffusion directions impact the magnitude and variation of QBI indices in both white matter and gray matter regions; however, QBI indices are most heavily dependent on the maximum order of the spherical harmonic (SH) series used to represent the diffusion orientation distribution function (ODF). Specifically, to ensure numerical stability and reduce the occurrence of false peaks and inflated anisotropy, we recommend oversampling by at least 8-12 more diffusion directions than the number of estimated coefficients for a given SH order. In addition, in an equal scan time comparison of QBI accuracy, we find that increasing the directional resolution of the HARDI dataset is preferable to repeating observations; however, our results indicate that as few as 32 directions at a low b-value (1000s/mm2) captures most of the angular information in the q-ball ODF. Our findings provide guidance for determining an optimal acquisition scheme for QBI in the low SNR and low scan time regime, and suggest that care must be taken when choosing the basis functions used to represent the QBI ODF.