Imaging Biomarkers in Thyroid Eye Disease and their Clinical Associations
Shikha Chaganti, Katrina Nelson, Kevin Mundy, Robert Harrigan, Robert Galloway, Louise A. Mawn, Bennett Landman, “Imaging biomarkers in thyroid eye disease and their clinical associations,” Journal of Medical Imaging. (2018), doi: 10.1117/1.JMI.5.4.044001.
Abstract
Purpose: The purpose of this study is to understand the phenotypes of thyroid eye disease (TED) through data derived from a multi-atlas segmentation of computed tomography (CT) imaging. Images of 170 orbits of 85 retrospectively selected TED patients were analyzed with the developed automated segmentation tool. Twenty-five bilateral orbital structural metrics were used to perform principal component analysis (PCA). PCA of the twenty-five structural metrics identified the two most dominant structural phenotypes or characteristics, the “big volume phenotype” and the “stretched optic nerve phenotype”, that accounted for 60% of the variance. Most of the subjects in the study have either of these characteristics or a combination of both. A Kendall rank correlation between the principal components (phenotypes) and clinical data showed that, the big volume phenotype was very strongly correlated (p-value<0.05) with motility defects, and loss of visual acuity. Whereas, the stretched optic nerve phenotype was strongly correlated (p-value<0.05) with an increased Hertel measurement, relatively better visual acuity, and smoking (Table 3). Two clinical subtypes of thyroid eye disease, Type 1 with enlarged muscles and Type 2 with proptosis, are recognizable in CT imaging. Our automated algorithm identifies the phenotypes and finds associations with clinical markers.
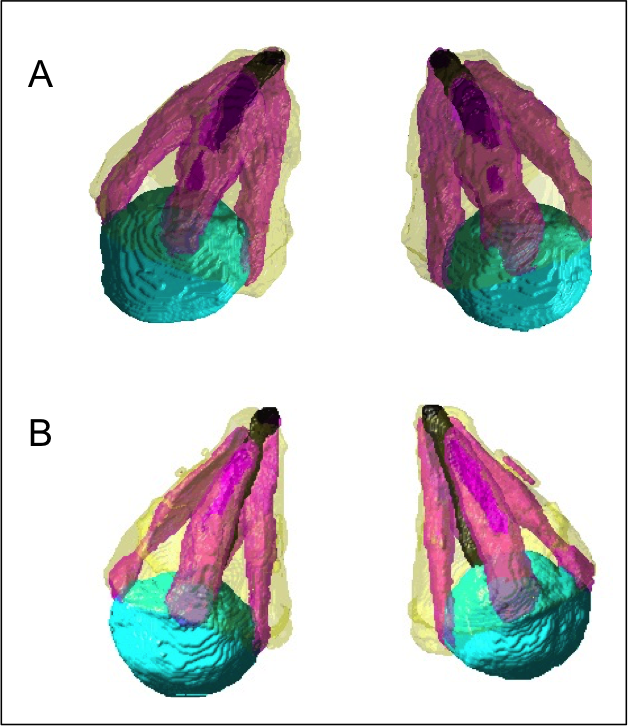
Figure. Subtypes of thyroid eye disease. A. Example of subtype 1 showing big muscles – with high values along component 1. B. Example of subtype 2 showing longer and thinner optic nerve, and greater orbital fat – with high values along component 2.