Consideration of Cerebrospinal Fluid Intensity Variation in Diffusion Weighted MRI
Colin B. Hansen, Vishwesh Nath, Allison E. Hainline, Kurt G. Schilling, Prasanna Parvathaneni, Roza G. Bayrak, Justin A. Blaber, Owen Williams, Susan Resnick, Lori Beason-Held, Okan Irfanoglu, Carlo Pierpaoli, Adam W. Anderson, Baxter P. Rogers, Bennett A. Landman, “Consideration of Cerebrospinal Fluid Intensity Variation in Diffusion Weighted MRI.” SPIE Medical Imaging, San Diego, CA, 2019
Abstract
Diffusion weighted MRI (DW-MRI) depends on accurate quantification signal intensities that reflect directional apparent diffusion coefficients (ADC). Signal drift and fluctuations during imaging can cause systematic non-linearities that manifest as ADC changes if not corrected. Here, we present a case study on a large longitudinal dataset of typical diffusion tensor imaging. We investigate observed variation in the cerebral spinal fluid (CSF) regions of the brain, which should represent compartments with isotropic diffusivity. The study contains 3949 DW-MRI acquisitions of the human brain with 918 subjects and 542 with repeated scan sessions. We provide an analysis of the inter-scan, inter-session, and intra-session variation and an analysis of the associations with the applied diffusion gradient directions. We investigate a hypothesis that CSF models could be used in lieu of an interspersed minimally diffusion-weighted image (b0) correction. Variation in CSF signal is not largely attributable to within-scan dynamic anatomical changes (3.6%), but rather has substantial variation across scan sessions (10.6%) and increased variation across individuals (26.6%). Unfortunately, CSF intensity is not solely explained by a main drift model or a gradient model, but rather has statistically significant associations with both possible explanations. Further exploration is necessary for CSF drift to be used as an effective harmonization technique.
Keywords: Diffusion, CSF, Variation, Signal, Drift
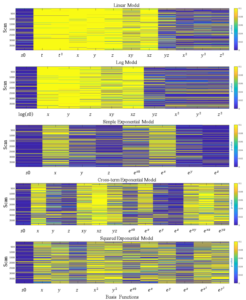
Each row corresponds to a model used to capture the variance in the left and right lateral ventricles. From top to bottom the models are the linear model, log model, simple exponential model, cross-term exponential model, and squared exponential model. Each row in the images represents p-values of the coefficients from the fitting the model to the median signal. Each column represents one of the terms that were used as the basis functions for the models.