A fiber coherence index for quality control of B-table orientation in diffusion MRI scans.
Kurt G Schilling, Fang-Cheng Yeh, Vishwesh Nath, Colin Hansen, Owen Williams, Susan Resnick, Adam W. Anderson, Bennett A. Landman. “A fiber coherence index for quality control of B-table orientation in diffusion MRI scans”. Magnetic Resonance Imaging. 2019. doi: 10.1016/j.mri.2019.01.018
Full text: https://www.ncbi.nlm.nih.gov/pubmed/?term=fiber+coherence+b-table
Abstract
Purpose
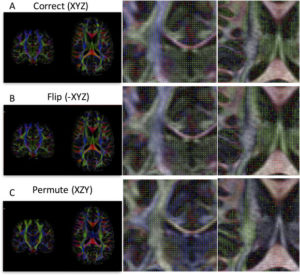
The diffusion MRI “b-vector” table describing the diffusion sensitization direction can be flipped and permuted in dimension due to different orientation conventions used in scanners and incorrect or improperly utilized file formats. This can lead to incorrect fiber orientation estimates and subsequent tractography failure. Here, we present an automated quality control procedure to detect when the b-table is flipped and/or permuted incorrectly.
Methods
We define a “fiber coherence index” to describe how well fibers are connected to each other, and use it to automatically detect the correct configuration of b-vectors. We examined the performance on 3981 research subject scans (Baltimore Longitudinal Study of Aging), 1065 normal subject scans of high image quality (Human Connectome Project), and 202 patient scans (Vanderbilt University Medical Center), as well as 9 in-vivo and 9 ex-vivo animal data.
Results
The coherence index resulted in a 99.9% (3979/3981) and 100% (1065/1065) success rate in normal subject scans, 98% (198/202) in patient scans, and 100% (18/18) in both in-vivo and ex-vivo animal data in detecting the correct gradient table in datasets without severe image artifacts. The four failing cases (4/202) in patient scans, and two failures in healthy subject scans (2/3981), all showed prominent motion or signal dropout artifacts.
Conclusions
The fiber coherence measure can be used as an automatic quality assurance check in any diffusion analysis pipeline. Additionally, the success of this fiber coherence measure suggests potential broader applications, including evaluating data quality, or even providing diagnostic value as a biomarker of white matter integrity.
