Longitudinal changes of connectomes and graph theory measures in aging
Yuzhe Wang, Francois Rheault, Kurt G. Schilling, Lori L. Beason-Held, Andrea T. Shafer, Susan M. Resnick, Bennett A. Landman
Abstract
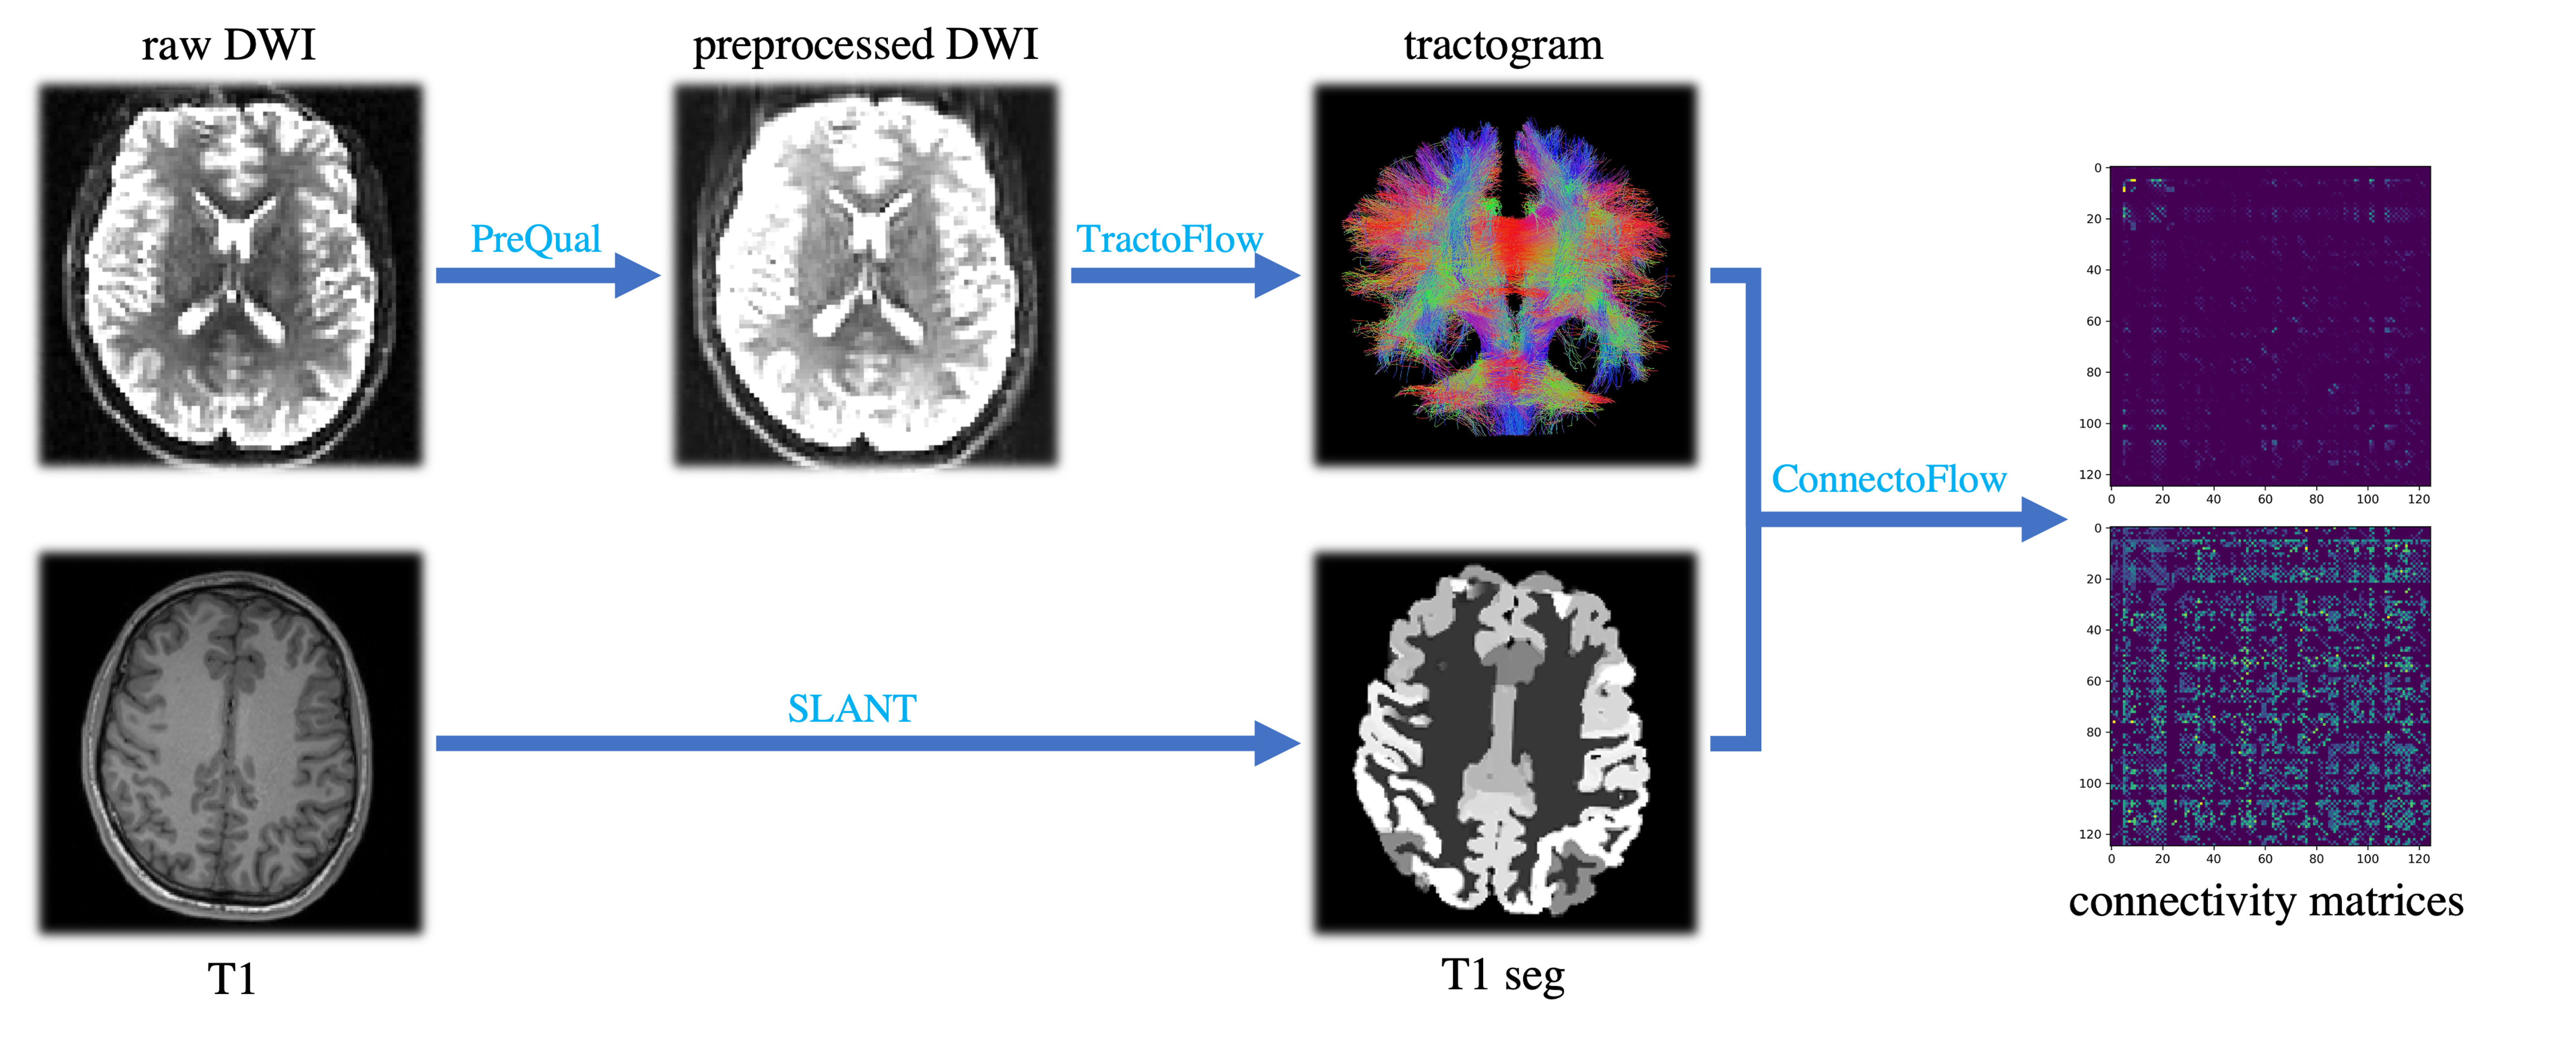
Changes in brain structure and connectivity in aging can be probed through diffusion weighted MRI and summarized with structural connectome matrices. Complex network analysis based on graph theory has been applied to provide measures that are correlated with neurobiological variations and can help guide quantitative study of brain function. However, the understanding of how connectomes change longitudinally is limited. In this work, we evaluate modern pipelines to obtain the connectomics data from diffusion weighted MRI scans across different sessions from control subjects (55-99 years old) in the Baltimore Longitudinal Study of Aging and Cambridge Centre for Ageing and Neuroscience. From the connectivity matrices, we compute graph theory measures to understand their brain networks and apply a linear mixed- effects model to study their longitudinal changes with respect to age. With this approach, we computed 14 graph theory measures of 1469 healthy subjects (2476 scans) and found statistically significant correlations between all 14 measures and age. In this analysis: 1) the brain becomes more segregated but less integrated in aging; 2) the overall network cost increases for older subjects; 3) the small-world organizations remain stable; and 4) due to high intra-subject variance, there is not clear trend for longitudinal changes of graph theory measures of individual subjects. Therefore, while useful to investigate brain evolution in aging at the population level, improvements in the connectome reconstruction are needed to decrease single subject variability for individual inference.
Keywords: Structural connectomes, diffusion MRI, aging, brain connectivity, graph theory, network analysis