pyPheWAS: A Phenome-Disease Association Tool for Electronic Medical Record Analysis
Kerley, C.I., Chaganti, S., Nguyen, T.Q. et al. pyPheWAS: A Phenome-Disease Association Tool for Electronic Medical Record Analysis. Neuroinform (2022). https://doi.org/10.1007/s12021-021-09553-4
Abstract
Along with the increasing availability of electronic medical record (EMR) data, phenome-wide association studies (PheWAS) and phenome-disease association studies (PheDAS) have become a prominent, first-line method of analysis for uncovering the secrets of EMR. Despite this recent growth, there is a lack of approachable software tools for conducting these analyses on large-scale EMR cohorts. In this article, we introduce pyPheWAS, an open-source python package for conducting PheDAS and related analyses. This toolkit includes 1) data preparation, such as cohort censoring and age-matching; 2) traditional PheDAS analysis of ICD-9 and ICD-10 billing codes; 3) PheDAS analysis applied to a novel EMR phenotype mapping: current procedural terminology (CPT) codes; and 4) novelty analysis of significant disease-phenotype associations found through PheDAS. The pyPheWAS toolkit is approachable and comprehensive, encapsulating data prep through result visualization all within a simple command-line interface. The toolkit is designed for the ever-growing scale of available EMR data, with the ability to analyze cohorts of 100,000 + patients in less than 2 h. Through a case study of Down Syndrome and other intellectual developmental disabilities, we demonstrate the ability of pyPheWAS to discover both known and potentially novel disease-phenotype associations across different experiment designs and disease groups. The software and user documentation are available in open source at https://github.com/MASILab/pyPheWAS.
Keywords: PheWAS, PheDAS, Electronic Medical Records, Phenotype, ICD
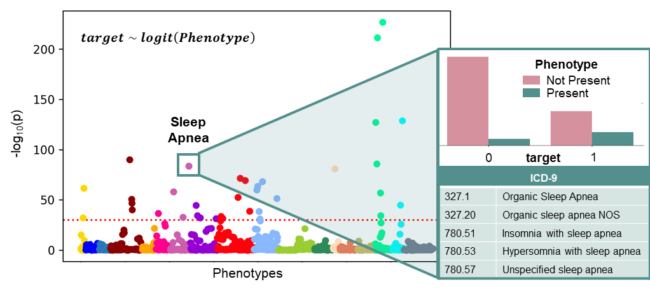
Fig. 1 Overview of PheDAS. In the background, a Manhattan plot shows the statistical significance of many phenotypes in relation to a single target variable (target). Phenotypes are sorted into and colored by category, and the significance threshold for multiple comparisons correction is marked with a dashed horizontal line. These relationships were estimated by individually modeling the target variable as a function of each phenotype using a logistic regression. For a closer look, the significant phenotype Sleep Apnea is highlighted. The distribution of subjects from each target group that do (not) present the Sleep Apnea phenotype is shown, along with the ICD-9 codes that map to this this phenotype.