Predicting Crohn’s disease severity in the colon using mixed cell nucleus density from pseudo labels
Lucas W. Remedios, Shunxing Bao, Cailey I. Kerley, Leon Y. Cai, François Rheault, Ruining Deng, Can Cui, Sophie Chiron, Ken S. Lau, Joseph T. Roland, Mary K. Washington, Lori A. Coburn, Keith T. Wilson, Yuankai Huo, Bennett A. Landman (2023). Predicting Crohn’s disease severity in the colon using mixed cell nucleus density from pseudo labels. SPIE Medical Imaging : Digital and Computational Pathology 2023.
Full text: NIHMSID
Abstract
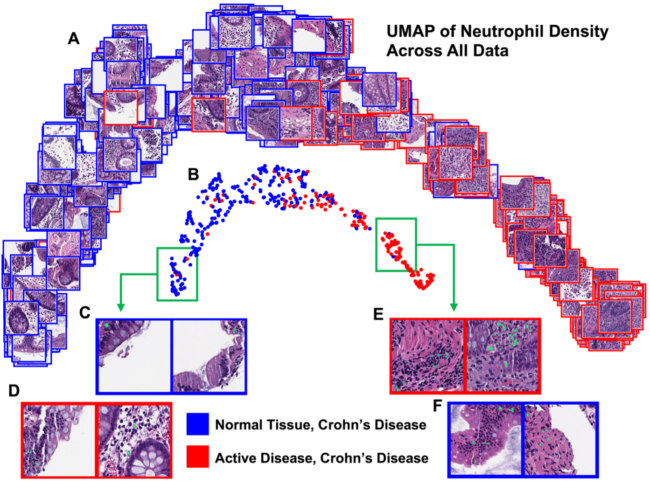
Crohn’s disease (CD) is a debilitating inflammatory bowel disease with no known cure. Computational analysis of hematoxylin and eosin (H&E) stained colon biopsy whole slide images (WSIs) from CD patients provides the opportunity to discover unknown and complex relationships between tissue cellular features and disease severity. While there have been works using cell nuclei-derived features for predicting slide-level traits, this has not been performed on CD H&E WSIs for classifying normal tissue from CD patients vs active CD and assessing slide label-predictive performance while using both separate and combined information from pseudo-segmentation labels of nuclei from neutrophils, eosinophils, epithelial cells, lymphocytes, plasma cells, and connective cells. We used 413 WSIs of CD patient biopsies and calculated normalized histograms of nucleus density for the six cell classes for each WSI. We used a support vector machine to classify the truncated singular value decomposition representations of the normalized histograms as normal or active CD with four-fold cross-validation in rounds where nucleus types were first compared individually, the best was selected, and further types were added each round. We found that neutrophils were the most predictive individual nucleus type, with an AUC of 0.92 ± 0.0003 on the withheld test set. Adding information improved cross-validation performance for the first two rounds and on the withheld test set for the first three rounds, though performance metrics did not increase substantially beyond when neutrophils were used alone.