Chenyu Gao, Bennett A. Landman, Jerry L. Prince, Aaron Carass. “Reproducibility evaluation of the effects of MRI defacing on brain segmentation”. J. Med. Imag. 10(6), 064001 (2023), https://doi.org/10.1117/1.JMI.10.6.064001, [PDF]
Abstract
Purpose
Recent advances in magnetic resonance (MR) scanner quality and the rapidly improving nature of facial recognition software have necessitated the introduction of MR defacing algorithms to protect patient privacy. As a result, there are a number of MR defacing algorithms available to the neuroimaging community, with several appearing in just the last 5 years. While some qualities of these defacing algorithms, such as patient identifiability, have been explored in the previous works, the potential impact of defacing on neuroimage processing has yet to be explored.
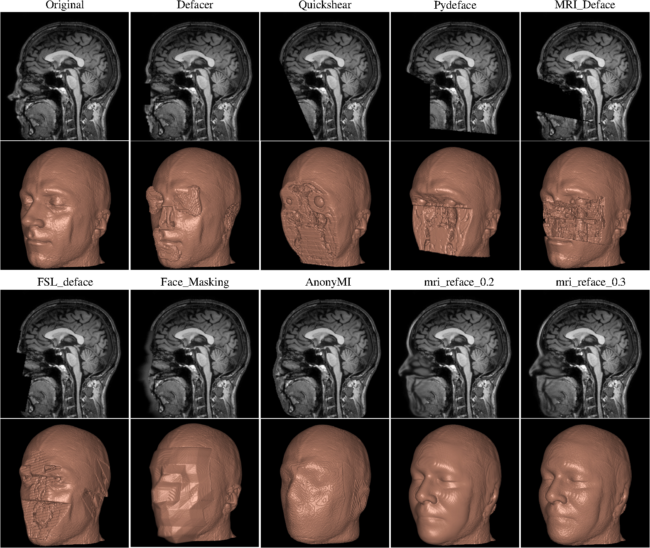
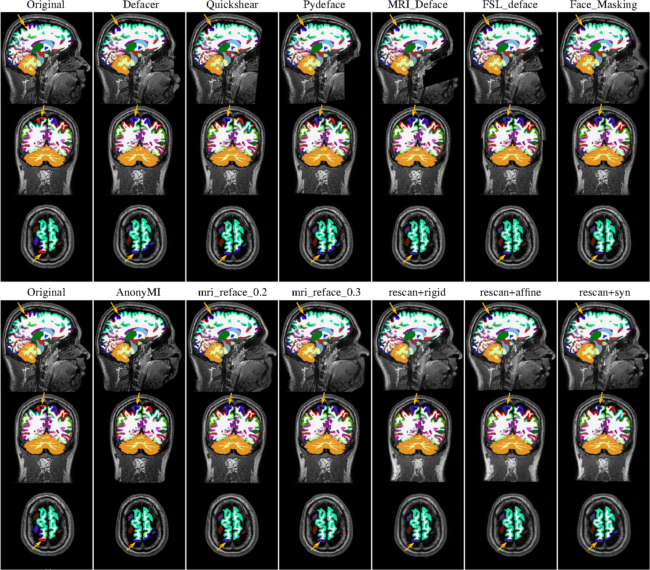
Fig. 1 A sagittal slice of an MRI is displayed over the reconstruction of the whole head MRI. Top set of images from left to right is the acquired MRI and then defacing using Defacer, QuickShear, Pydeface, and MRI_Deface. The bottom set of images from left to right is defacing using FSL_Deface, Face_Masking, AnonyMI, mri_reface_0.2, and mri_reface_0.3.
Approach
We qualitatively evaluate eight MR defacing algorithms on 179 subjects from the OASIS-3 cohort and 21 subjects from the Kirby-21 dataset. We also evaluate the effects of defacing on two neuroimaging pipelines—SLANT and FreeSurfer—by comparing the segmentation consistency between the original and defaced images.
Results
Defacing can alter brain segmentation and even lead to catastrophic failures, which are more frequent with some algorithms, such as Quickshear, MRI_Deface, and FSL_deface. Compared to FreeSurfer, SLANT is less affected by defacing. On outputs that pass the quality check, the effects of defacing are less pronounced than those of rescanning, as measured by the Dice similarity coefficient.
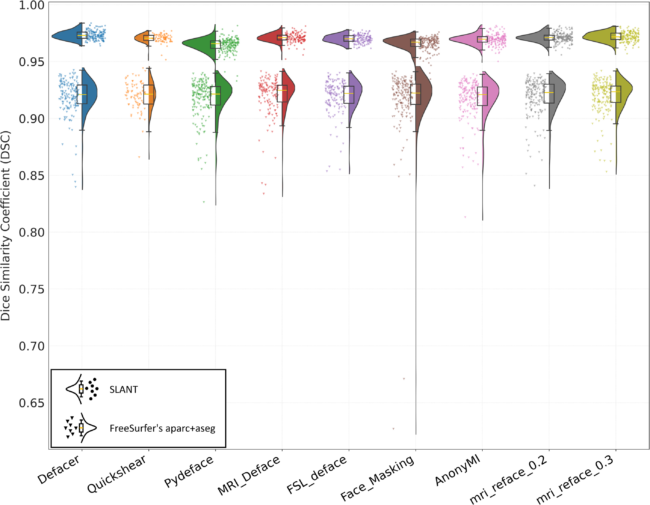
Fig. 2 DSC between the segmentations of the unaltered images and the defaced images in the OASIS-3 cohort: In each column, we present the results for a specific defacing algorithm with two “raincloud” plots. The raincloud plots with the “cloud” on the left correspond to the SLANT comparison, whereas the plots with the “cloud” on the right correspond to FreeSurfer. The individual “raindrops” correspond to the mean DSC of the labels (by SLANT or FreeSurfer) of a specific subject from the OASIS-3 cohort.
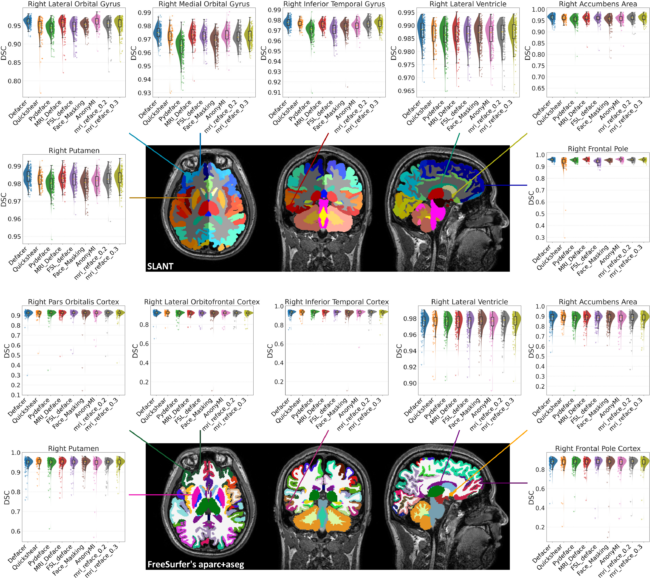
Fig. 3 DSC for the segmentation (of SLANT or FreeSurfer) between unaltered and defaced images for seven ROIs for subjects from the OASIS-3 cohort. The top collection of images shows SLANT labels on a particular subject from the OASIS-3 cohort. Surrounding the MRI are seven raincloud plots that correspond to specific ROIs. The bottom collection of images shows the FreeSurfer labels for the same OASIS-3 subject and raincloud plots for anatomically comparable ROIs.
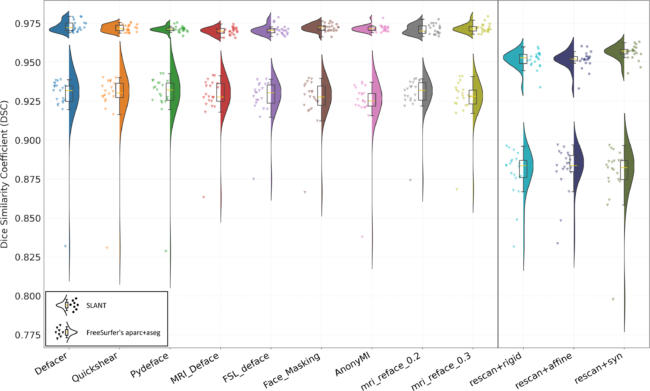
Fig.4 DSC between segmentations of the unaltered first scan, the defaced first scan, and aligned rescan on the Kirby-21 dataset. In each column, we present the results for the segmentation comparison between the unaltered first scan and either a defaced first scan or the unaltered rescan aligned to the first scan. The raindcloud plots are explained in Fig. 2. Key: “rescan+rigid”—rescan registered with rigid registration; “rescan+affine”—rescan registered with affine registration; “rescan+syn”—rescan registered with SyN based deformable registration.
Conclusions
The effects of defacing are noticeable and should not be disregarded. Extra attention, in particular, should be paid to the possibility of catastrophic failures. It is crucial to adopt a robust defacing algorithm and perform a thorough quality check before releasing defaced datasets. To improve the reliability of analysis in scenarios involving defaced MRIs, it is encouraged to include multiple brain segmentation pipelines.
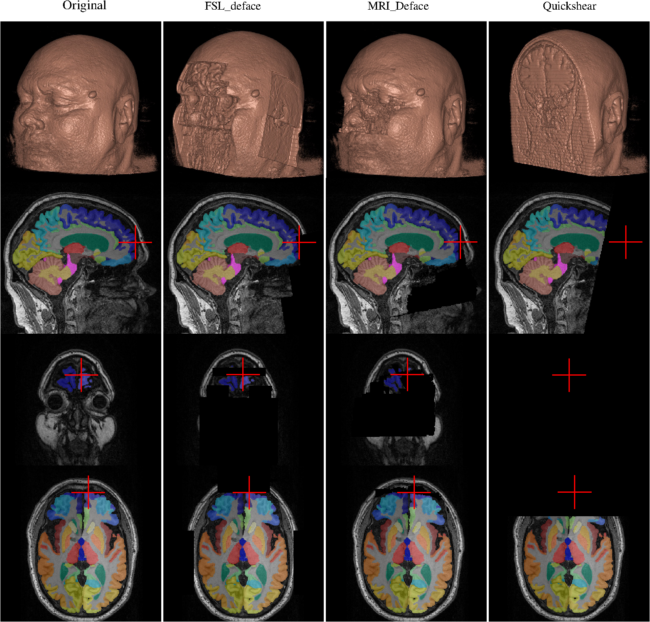
Fig. 5 Example of type II failure cases. The columns from left to right show the unaltered (original) data and the results of FSL_deface, MRI_Deface, and Quickshear. The rows from top to bottom show 3D renderings of the head before and after defacing by the three algorithms, then sagittal, coronal, and axial slices with their corresponding SLANT segmentation overlaid. The red cross marks the same position in each image and shows where brain voxels are removed by defacing.
Fig. 6 FreeSurfer outlier comparison. MRIs overlaid with their corresponding FreeSurfer segmentations. The arrows point to a location where the label given by FreeSurfer segmentation changed dramatically after processing either by a defacing algorithm or the registration of the rescan image. We repeat the original FreeSurfer results on both the top and bottom left column for easier comparison across the rows.
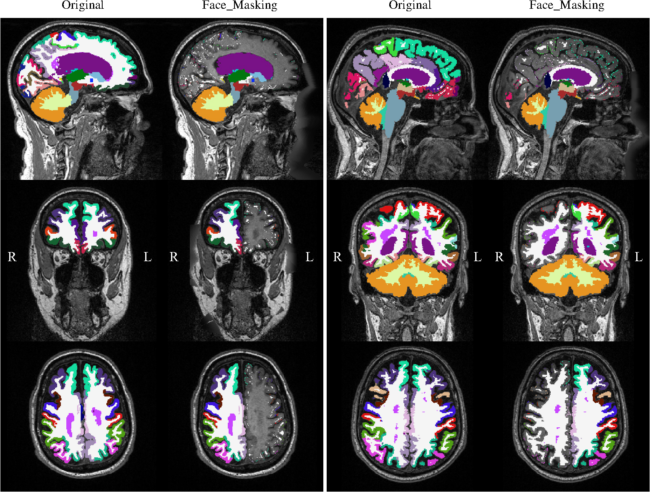
Fig. 7 Two FreeSurfer outliers. MRIs overlaid with their corresponding FreeSurfer segmentations. The left two columns are results from unaltered (original) MRI and defaced by Face_Masking for one subject, and the right two columns are from another subject. These are the worst two subjects in our comparison with mean DSC below 0.7. Key: “L” denotes left and “R” denotes right.