Identification of functional white matter networks in BOLD fMRI
Alexa L. Eby, Lucas W. Remedios, Michael E. Kim, Muwei Li, Yurui Gao, John C. Gore, Kurt G. Schilling, Bennett A. Landman “Identification of functional white matter networks in BOLD fMRI”
Abstract
White matter signals in resting state blood oxygen level dependent functional magnetic resonance (BOLD-fMRI) have been largely discounted, yet there is growing evidence that these signals are indicative of brain activity. Understanding how these white matter signals capture function can provide insight into brain physiology. Moreover, functional signals could potentially be used as early markers for neurological changes, such as in Alzheimer’s Disease. To investigate white matter brain networks, we leveraged the OASIS-3 dataset to extract white matter signals from resting state BOLD-FMRI data on 711 subjects. The imaging was longitudinal with a total of 2,026 images. Hierarchical clustering was performed to investigate clusters of voxel-level correlations on the timeseries data. The stability of clusters was measured with the average Dice coefficients on two different cross fold validations. The first validated the stability between scans, and the second validated the stability between subject populations. Functional clusters at hierarchical levels 4, 9, 13, 18, and 24 had local maximum stability, suggesting better clustered white matter. In comparison with JHU-DTI-SS Type-I Atlas defined regions, clusters at lower hierarchical levels identified well defined anatomical lobes. At higher hierarchical levels, functional clusters mapped motor and memory functional regions, identifying 50.00%, 20.00%, 27.27%, and 35.14% of the frontal, occipital, parietal, and temporal lobe regions respectively.
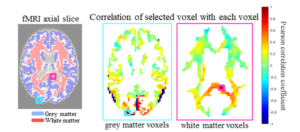
identify anatomical regions7
(left). In a similar manner, we hypothesize correlations can be identified between white matter voxels
(right), providing evidence there may be informative white matter correlations in resting state BOLD fMRI data.
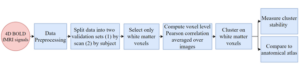
white matter voxels. BOLD fMRI signals containing multiple subjects with multiple scans each were preprocessed and
standardized using a customized pipeline based on the DPABI toolbox. To measure cluster stability, two validation tests
were completed- one set by assigning each scan to a cohort, and the second set by assigning each subject to a cohort. White
matter voxels were extracted from the BOLD signals using a group-wise white matter mask. Pearson correlation coefficients
were computed for each voxel in the image and averaged across all images. Then, white matter voxels were clustered using
average-linkage hierarchical clustering with distance between voxels measured as 1-correlation. Lastly, the average Dice
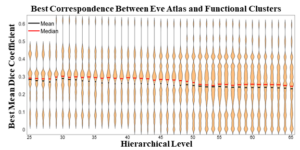
coefficient of clusters at different hierarchical levels was used to identify stable clusters which can be visually compared to
know anatomical brain regions. This clustering technique was also compared to the JHU-DTI-SS Type-I Atlas
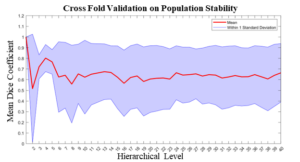
distinct brain regions are better identified at these levels (Figure 4). When visualizing, at a hierarchical level of 4 the major
lobes are defined. As the hierarchical level increases, motor and sensory regions of the brain are identified, which are
expected to be active at resting state.
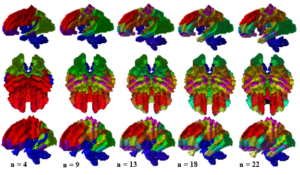
The number of clusters at a hierarchical level are equal to the hierarchical level. At the lower hierarchical levels (left) the regions
correspond closely to the lobe regions. As the hierarchical level increases, regions are identified that are consistent with sensory and
motor function regions (right).
frontal lobe, 2 of 10 occipital lobe, 3 of 11 parietal lobe, and 5 of 14 temporal lobe regions are identified in the functional
clusters. Although the regions are consistent with the functional memory regions that are active during resting state, the best
Dice coefficients are small, suggesting functional clustering is distinct from a structural parcellation.
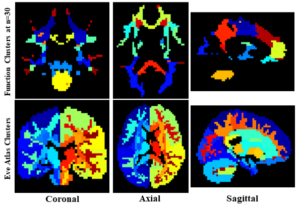
functional parcellation is different from the structural parcellation identified by the Eve Atlas (bottom).