Chenyu Gao, Michael E. Kim, Ho Hin Lee, Qi Yang, Nazirah Mohd Khairi, Praitayini Kanakaraj, Nancy R. Newlin, Derek B. Archer, Angela L. Jefferson, Warren D. Taylor, Brian D. Boyd, Lori L. Beason-Held, Susan M. Resnick, The BIOCARD Study Team, Yuankai Huo, Katherine D. Van Schaik, Kurt G. Schilling, Daniel Moyer, Ivana Išgum, Bennett A. Landman. “Predicting Age from White Matter Diffusivity with Residual Learning”. https://arxiv.org/abs/2311.03500
Abstract
Imaging findings inconsistent with those expected at specific chronological age ranges may serve as early indicators of neurological disorders and increased mortality risk. Estimation of chronological age, and deviations from expected results, from structural magnetic resonance imaging (MRI) data has become an important proxy task for developing biomarkers that are sensitive to such deviations. Complementary to structural analysis, diffusion tensor imaging (DTI) has proven effective in identifying age-related microstructural changes within the brain white matter, thereby presenting itself as a promising additional modality for brain age prediction. Although early studies have sought to harness DTI’s advantages for age estimation, there is no evidence that the success of this prediction is owed to the unique microstructural and diffusivity features that DTI provides, rather than the macrostructural features that are also available in DTI data. Therefore, we seek to develop white-matter-specific age estimation to capture deviations from normal white matter aging. Specifically, we deliberately disregard the macrostructural information when predicting age from DTI scalar images, using two distinct methods. The first method relies on extracting only microstructural features from regions of interest (ROIs). The second applies 3D residual neural networks (ResNets) to learn features directly from the images, which are non-linearly registered and warped to a template to minimize macrostructural variations. When tested on unseen data, the first method yields mean absolute error (MAE) of 6.11 ± 0.19 years for cognitively normal participants and MAE of 6.62 ± 0.30 years for cognitively impaired participants, while the second method achieves MAE of 4.69 ± 0.23 years for cognitively normal participants and MAE of 4.96 ± 0.28 years for cognitively impaired participants. We find that the ResNet model captures subtler, non-macrostructural features for brain age prediction.
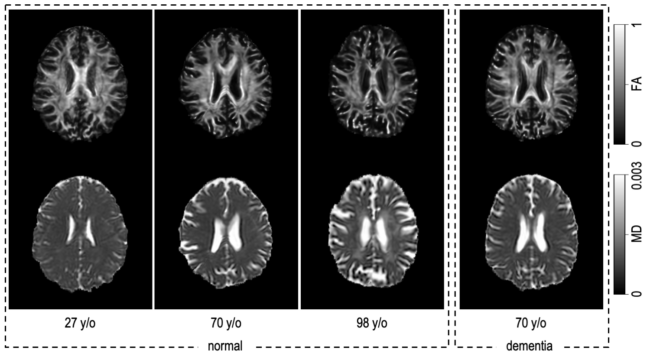
Fig. 1 The premise of this effort is that the brain undergoes macrostructural and microstructural changes throughout the normal aging process. At left above, we can appreciate that there are microstructural changes—as shown in fractional anisotropy (FA)—mainly characterized by a decrease in FA (top row). Additionally, there are diffusivity changes, with increased diffusivity in the white matter, notably in the central white matter, as shown in mean diffusivity (MD) (bottom row). We would like to know if prediction of the chronological age from microstructure could provide a useful biomarker to detect abnormal aging as a difference between the age one might predict from a participant with dementia (shown right), versus their true chronological age.
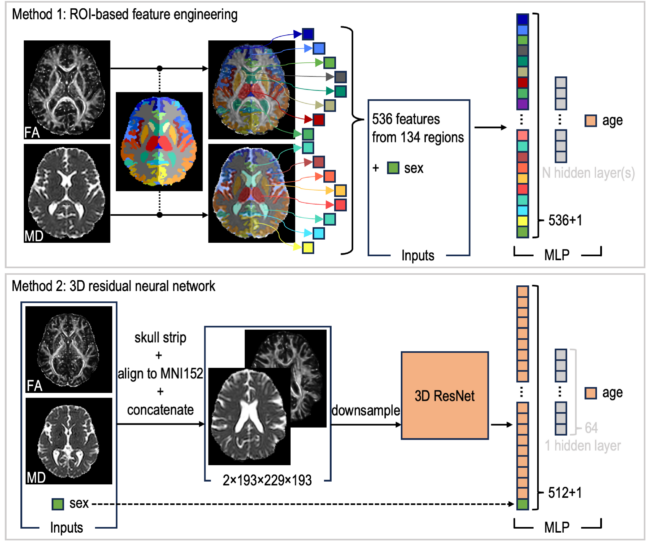
Fig. 2 The ROI-based feature engineering method uses mean and standard deviation values of FA and MD within each ROI (segmented by SLANT), alongside the sex of the participant, to feed into an MLP. The 3D ResNet method extracts features from preprocessed images. These features, once concatenated with the participant’s sex, are then processed by an MLP, with or without a hidden layer, to generate a prediction of the participant’s age.
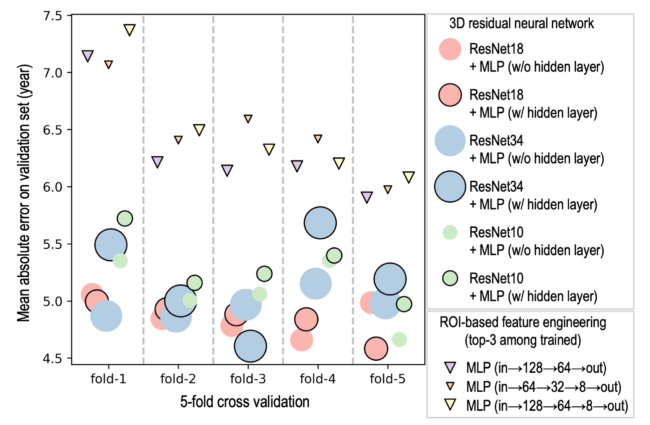
Fig. 3 The best model from the ROI-based feature engineering method, MLP with layers arranged as (input→128→64→output), is significantly worse than the worst model from the 3D ResNet method, ResNet10 concatenated with an MLP that has one hidden layer (t-statistic=3.83, p-value=0.019). ResNet18 (with hidden layer in the MLP) is significantly better (t-statistic=2.905, p-value=0.044) than ResNet10 (with hidden layer in the MLP), and better (t-statistic=2.347, p-value=0.079) than ResNet34 (with hidden layer in the MLP). Having a hidden layer in the MLP does not necessarily improve the performance. For instance, ResNet10 (with hidden layer in the MLP) is significantly worse (t-statistic=3.629, p-value=0.022) than ResNet10 (without hidden layer in the MLP). The size of the markers represents the relative complexity of the models (as measured by the number of trainable parameters) in comparison to other models from the same method. (All t-statistic and p-value presented here are calculated from paired t-test)
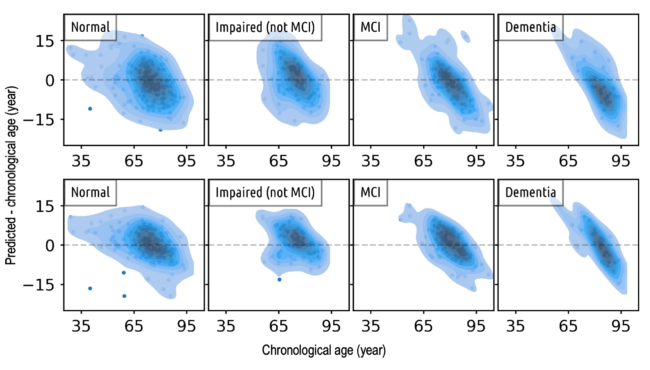
Fig. 4 Cross-sectional comparison of age predictions made by the top-performing model from both the ROI-based feature engineering approach (top row) and the 3D ResNet method (bottom row) shows that: i) In comparison to the predictions made by the ROI-based feature engineering method, the ages predicted by the ResNet model generally align more closely with the chronological ages; ii) As we transition from normal, to impaired, to MCI, and finally, to dementia, the density distribution becomes increasingly narrower and more diagonal. This pattern suggests a trend of diminishing model performance as the severity of the disease increases.
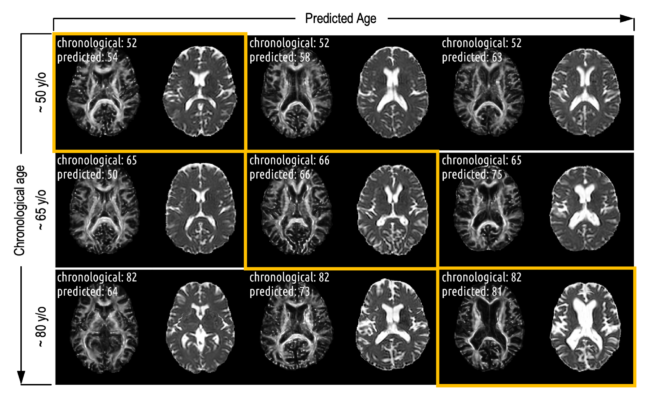
Fig. 5 There are more pronounced changes of the brain along the predicted age axis compared to the chronological age axis. While macrostructural changes (those remained after the registrations) like ventricle enlargement apparently influence age prediction in older participants, they are not the primary factors driving the age prediction, particularly for participants with predicted ages under 70. In these cases, subtler features, distinct from apparent macrostructural changes, are guiding the prediction.