Pancreas CT Segmentation by Predictive Phenotyping
Y. Tang, R.Gao, H.H.Lee, Q.Yang, X.Yu,Y.Zhou, S.Bao, Y.Huo, J.Spraggins, J.Virostko, Z.Xu, B.A. Landman. “Pancreas CTSegmentation by Predictive Phenotyping”. International Conference on MedicalImage Computing and Computer Assisted Intervention(MICCAI), 2021
Full Text:
https://link.springer.com/chapter/10.1007/978-3-030-87193-2_3
Abstract
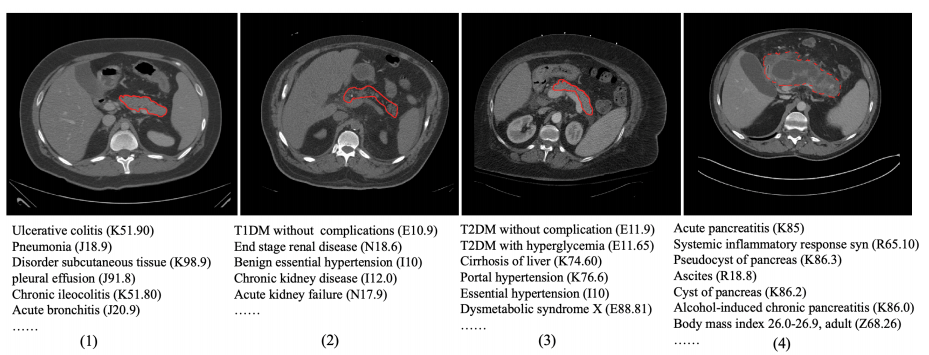
Pancreas CT segmentation offers promise at understanding the structural manifestation of metabolic conditions. To date, the medical primary record of conditions that impact the pancreas is in the electronic health record (EHR) in terms of diagnostic phenotype data (e.g., ICD-10 codes). We posit that similar structural phenotypes could be revealed by studying subjects with similar medical outcomes. Segmentation is mainly driven by imaging data, but this direct approach may not consider differing canonical appearances with different underlying conditions (e.g., pancreatic atrophy versus pancreatic cysts). To this end, we exploit clinical features from EHR data to complement image features for enhancing the pancreas segmentation, especially in high-risk outcomes. Specifically, we propose, to the best of our knowledge, the first phenotype embedding model for pancreas segmentation by predicting representatives that share similar comorbidities. Such an embedding strategy can adaptively refine the segmentation outcome based on the discriminative contexts distilled from clinical features. Experiments with 2000 patients’ EHR data and 300 CT images with the healthy pancreas, type II diabetes, and pancreatitis subjects show that segmentation by predictive phenotyping significantly improves performance over state-of-the-arts (Dice score 0.775 to 0.791, p < 0.05, Wilcoxon signed-rank test). The proposed method additionally achieves superior performance on two public testing datasets, BTCV MICCAI Challenge 2015 and TCIA pancreas CT. Our approach provides a promising direction of advancing segmentation with phenotype features while without requiring EHR data as input during testing.